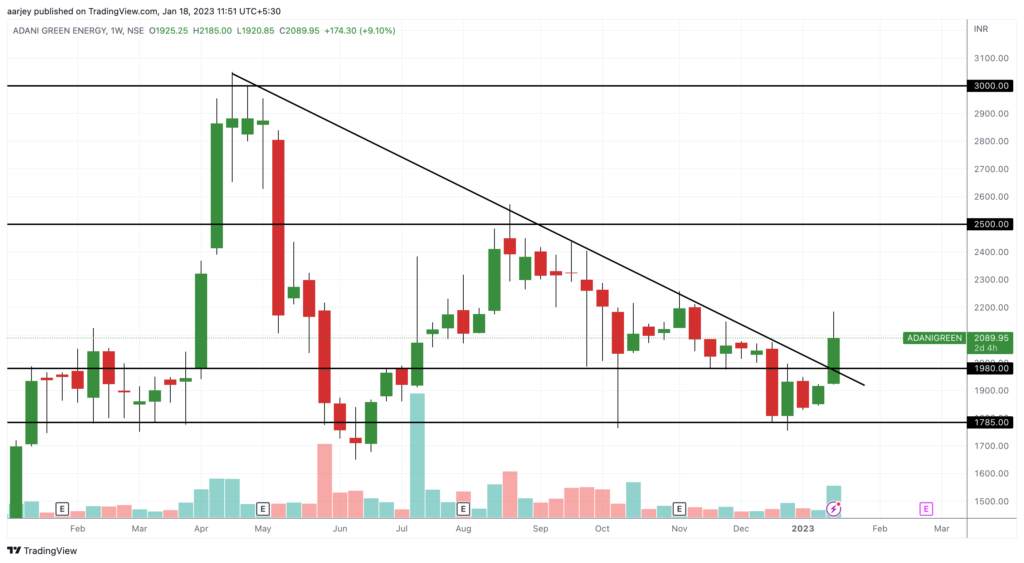
Let’s look the Adani Green chart. In weekly chart you can clearly see that it was trading in a triangle from long and now it has given the break-out. This break-out also has good volume.
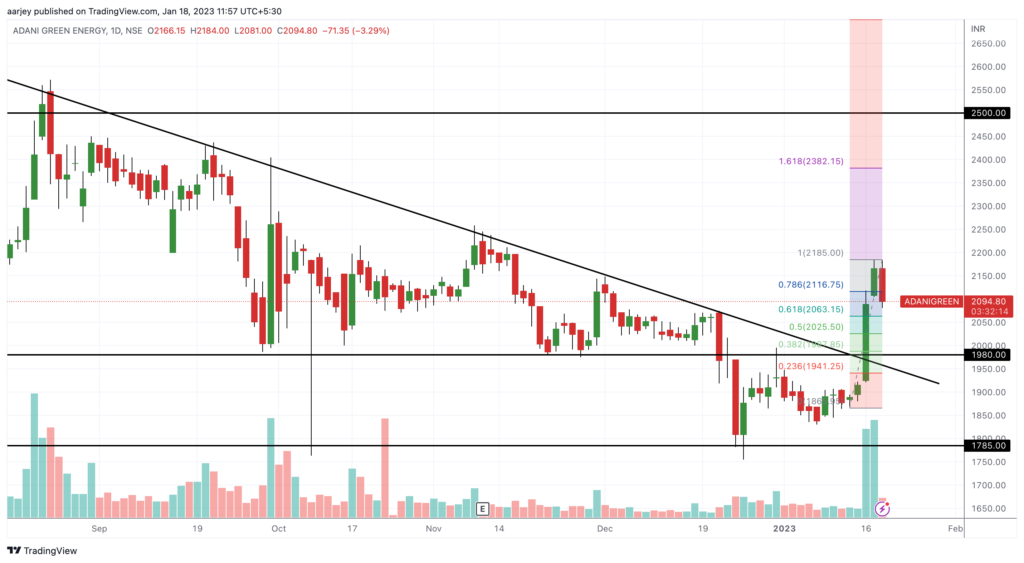
So when to enter in it? Let’s see the daily chart. In daily chart, we can see that it has given break-out and now coming down to retest. Using the Fib, we can find good entry points. Fib 0.5 level is at 2025 approx. This is our first entry point. Enter with 50% quantity near this level. Once it starts it upside journey again, you may enter rest of the 50% near 0.6 or 0.7 levels (2063, 2116). Hold it for long and targets can be amazing like 2382 and beyond. (Positional View) Happy Trading 😊