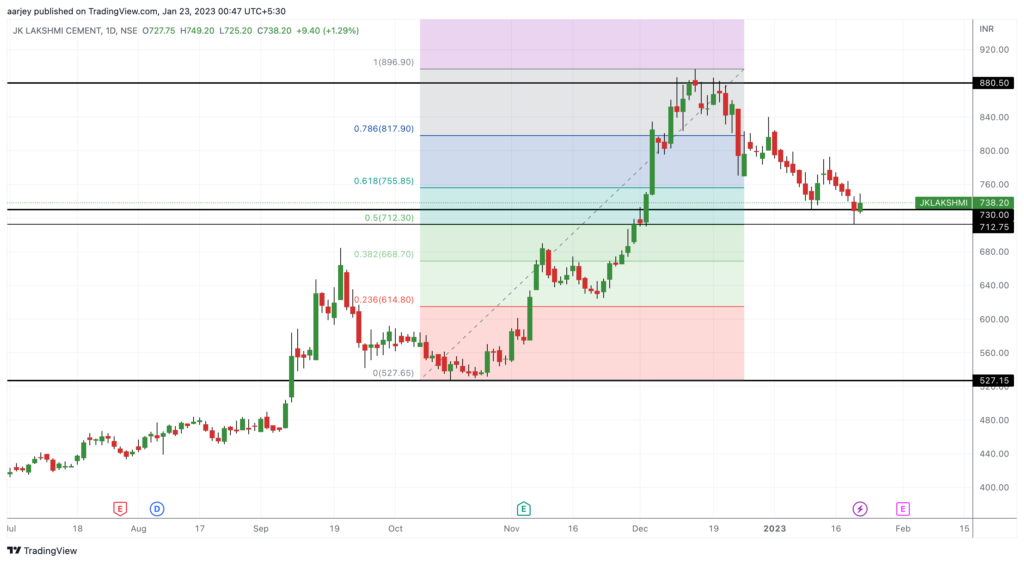
Today let’s analyse JK Lakshmi Cement. This stock is currently trading at 738.20. First look at the weekly chart. As we can see in weekly chart, it formed a nice price action. After breaking the resistance of 527, it took support (or may call – it retested) and then started to move up. After hitting 880+ resistance zone, it retraced to a good fib level of 0.5 and now its getting ready to start the bullish journey again.
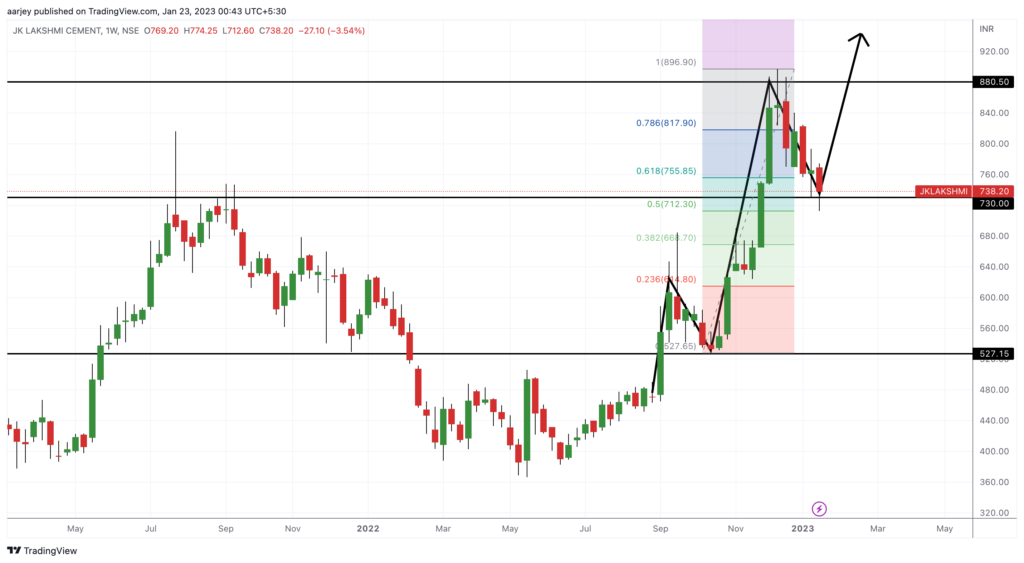
So how to enter and when to enter. Entry will trigger, once it create a green candle in weekly chart. We may take entry for 50% of the quantity and rest 50% we can enter once it breaks it ATH resistance zone. Obviously, so the first target would be around 880. In daily chart, it already created a small green candle. One may also take entry after two green daily candles. Positional View. Happy Trading .