Let’s see the chart of Hindustan Aeronautics (HAL). In chart, we can see that its all time support zone is somewhere 2400 – 2420. On 19th Jan, it took support on it and formed a green candle. The very next day, it formed a good green candle and gave a break-out with a solid green candle. On next day it took a pause and now continuing its upward journey. Currently it looks like it may face some resistance near 2560 approx. Keep an eye on its move and as it gives a break-out from this level(on daily closing basis) enter [buy] with 50% quantity (and rest 50% use if it comes to retest). We can expect positional targets of 2775 – 2800. If it falls back on all time support you may average it with remaining 50% quantity. (Positional View). Happy Trading 😊👍
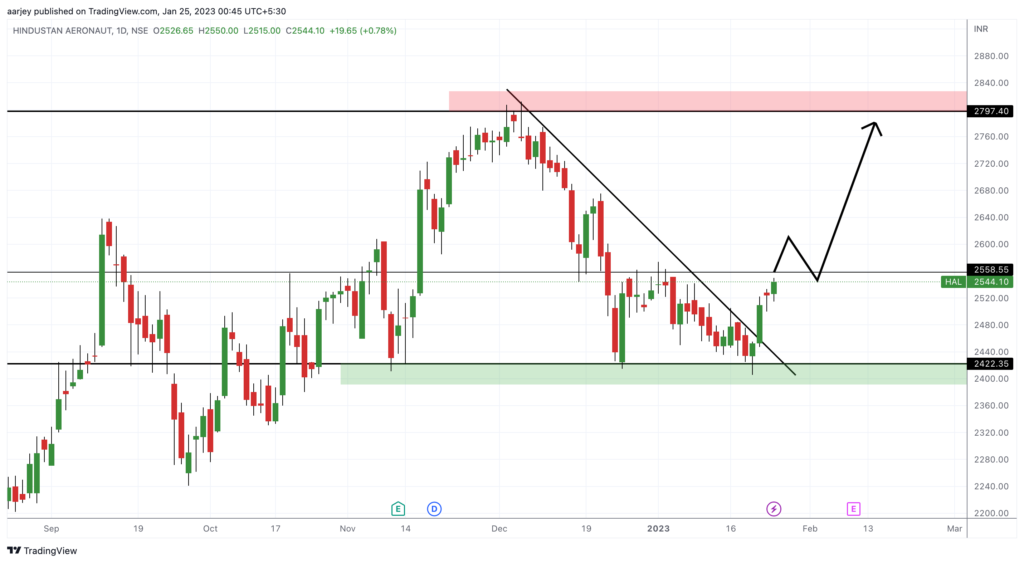

This trade was “Wowsome”. All targets hit. Currently its trading at 3005. So from 2544 to 3005… huge profit of 18%+ in just 3 months.
