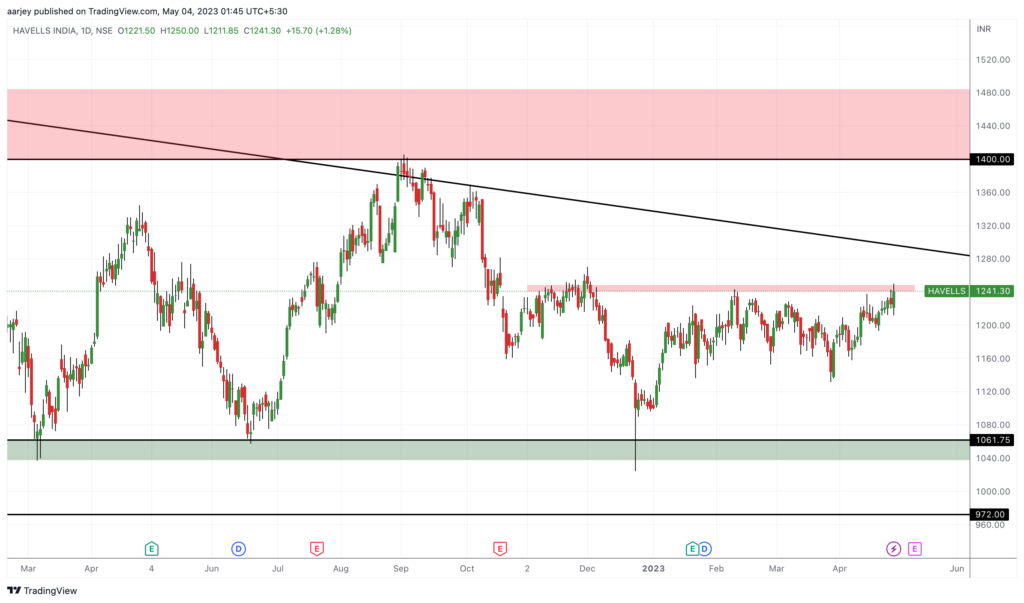
Today we are analysing Havells Stock. In weekly chart we can clearly see that its support zone is near 1060 and it bounced everytime it came down to that support level. Last time in Dec 2022, it took the support and now slowly moving up. We can also see that its inside a triangle. Its resistance zone is 1400 to 1470.
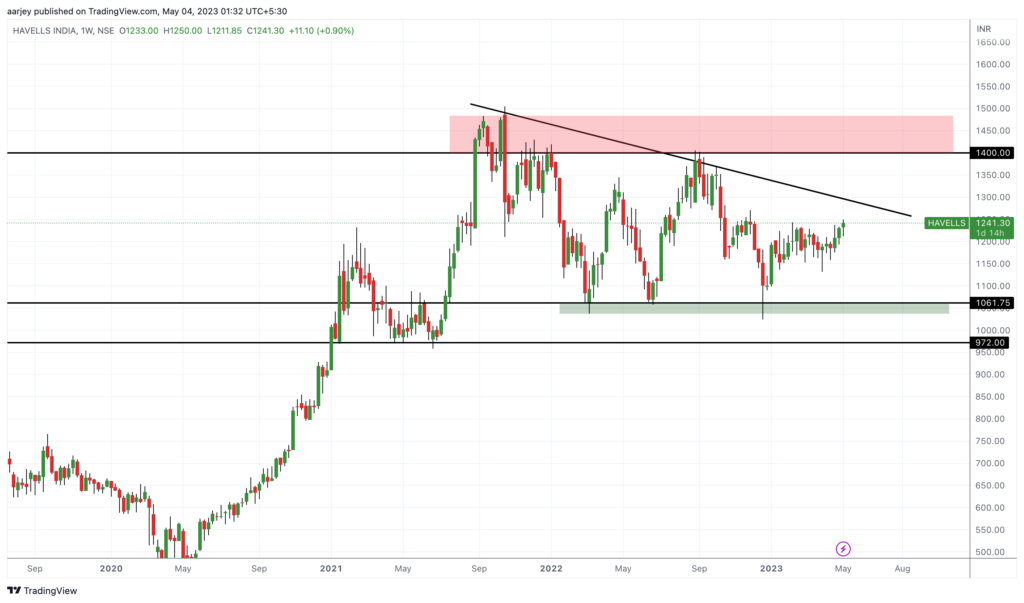
So, how and when we can enter. We can enter with half quantity now i.e. near 1240. You may book profit near 1300 or hold till 1400. If it gives a breakout out of the triangle you can re-enter or make the quantity full and hold for target of 1300+. If it goes down, you can accumulate stock if it takes support again near 1060. Happy Trading 😊