Kalyan Jewellers India Ltd. owns and operates jewellery stores. Today we are analysing charts of this stock.
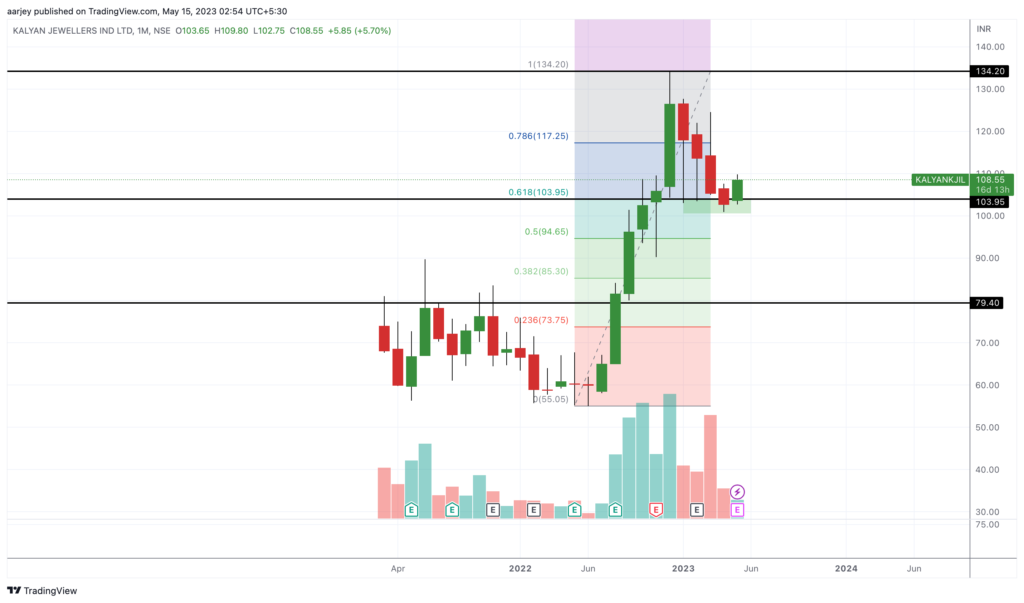
First let’s see its monthly chart. In monthly chart, we can clearly see that its bullish move started in June 2022 and it showed a good up move and a made a high of 134 (more than double from the lows) in Dec. 2022. From Jan 2023 till Apr 2023, it showed correction. If we see the Fib retracement, it touched 0.6 level and then took support on this level. In May 2023 so far, its forming a green candle.
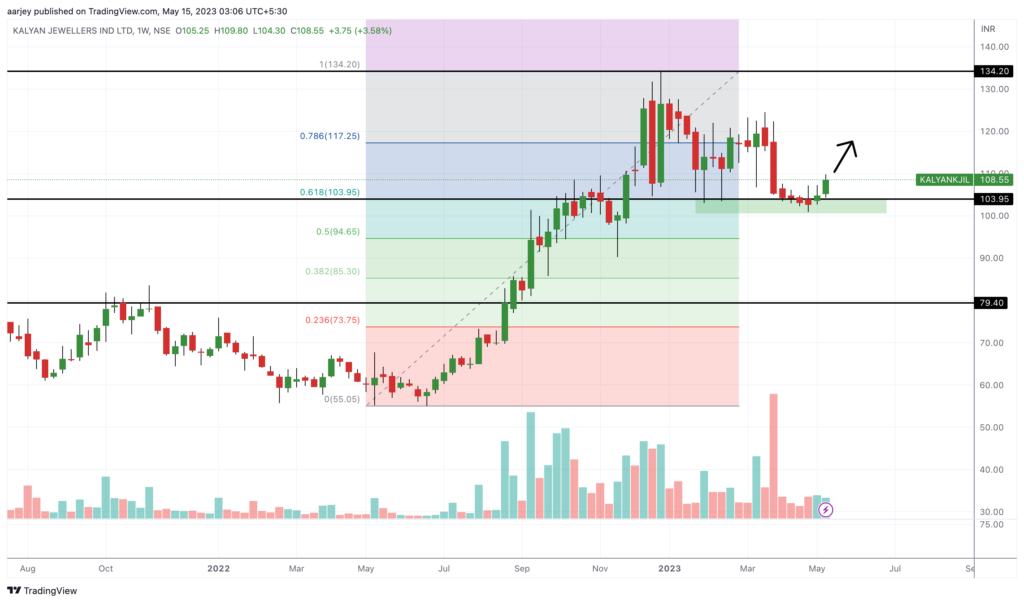
Now, let’s see its weekly chart. In this chart we can see that, after good correction, its again taking support near 104 and two green candles are formed. Now how we can take entry? Entry can be taken anywhere between, 104 and 109. Keep an SL of 100 and keep invested for first target of 117 (0.7 Fib Level) and next target as 126 – 134. This is positional view. Happy Trading. 😊

UPDATE: Kalyan Jewellers not only met the target but gave massive 100% + returns in just 3 months. Isn’t it wowsome 🤑 ✌️
Entry Price: 109
SL was at: 100
Current Price: 222.75
Profit: 103 %
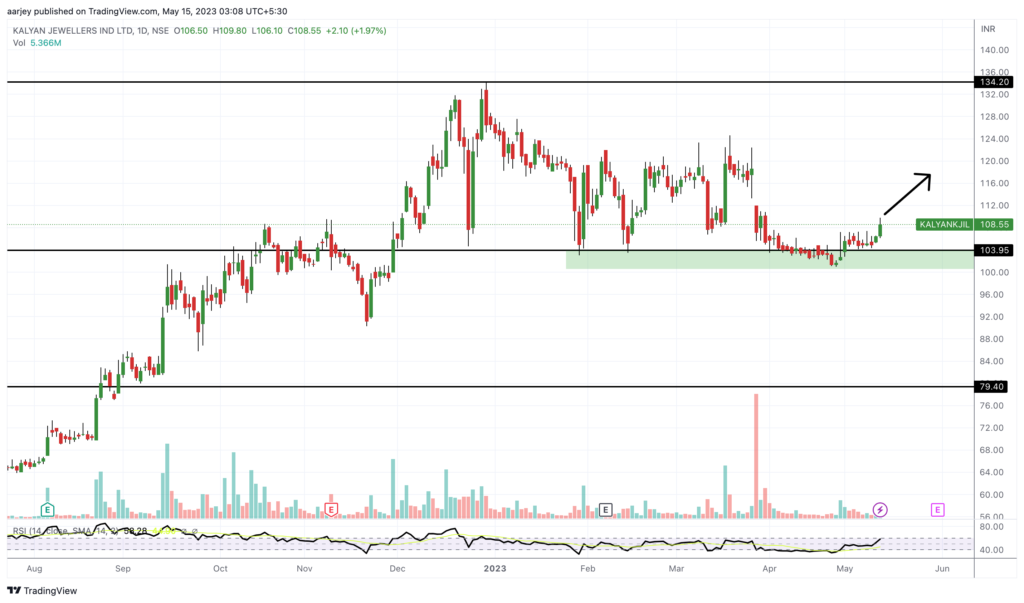
See the below latest chart. Enjoy! WowsomeTrades