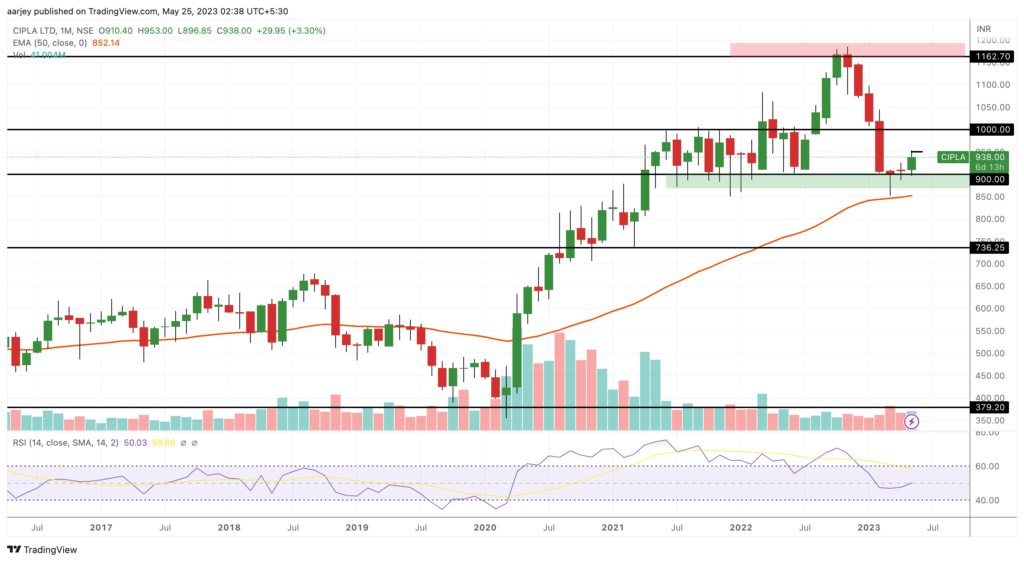
Cipla Ltd is a popular name in healthcare products and pharmaceutical industry. Let’s analyse its stock today. First lets see its monthly chart. In monthly chart we can clearly see that May candle is taking support on 900 level which is its strong support level.
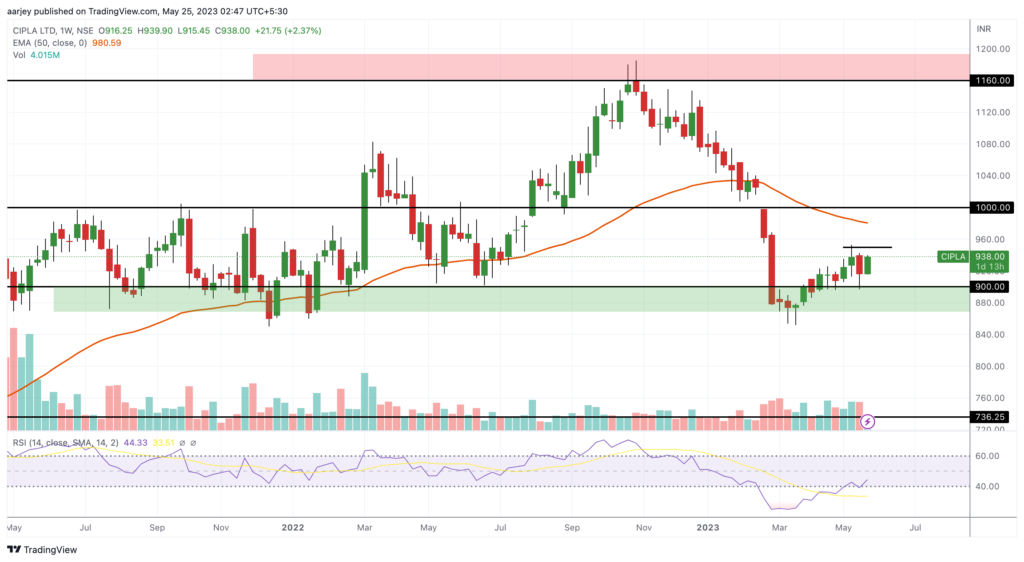
Now lets see its weekly chart. In weekly chart we can see that it has resistance levels near 1000 and 1160. Also, we can see a range shift in RSI which indicates that stock is not willing to fall more and should remain above 40 RSI. So now what we can do with this stock. There are two ways:
1. Position in stock – We can enter in stock with half quantity at current levels (or above 950) and if it comes again close to 900 level we will invest the remaining half. Our first target will be 1000. There we can book full or half as per our choice. Keep an SL of around 850 or as per your risk capacity. (Positional to short term view)
2. Options Selling – Sell puts of strike price 880 or below of June expiry and keep it melting until stock trades above 900 level. (* Risky trade. Only trade if you have experience in options selling. )