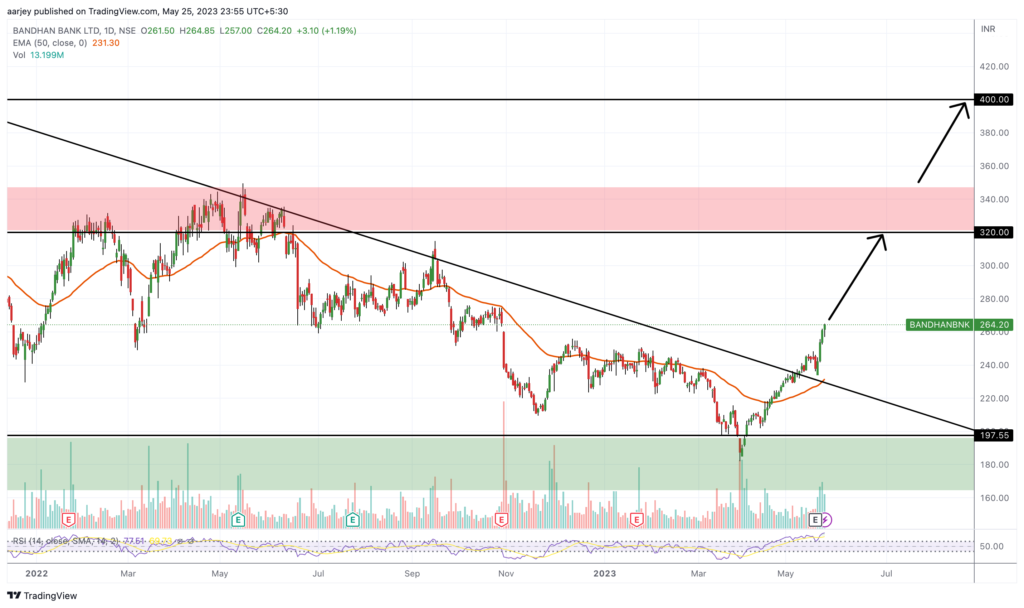
Bandhan Bank stock technical analysis is here. First let’s analyse its monthly chart. In monthly chart we can see that its strong support level is near 200. As soon as stock hit this support level in Mar 2023, it bounced and we can see green candles for Apr & May 2023. Also we can see the triangle pattern of this stock and its clear breakout from that triangle.
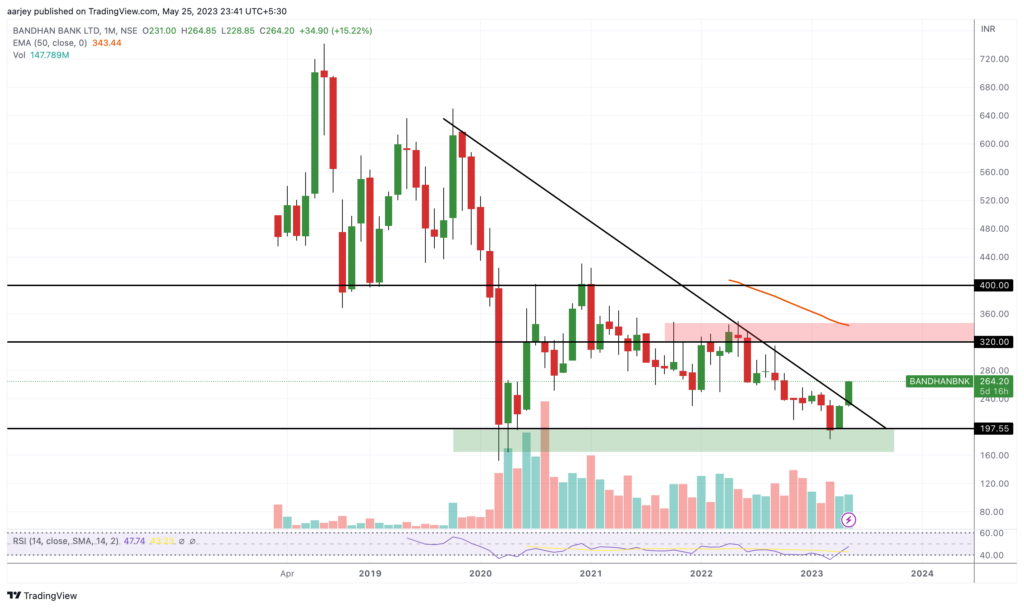
Now how we can take position in it. We can take entry close to 250 with half quantity. Rest half we can use if it comes down near 200 again. Our first target would be 320 and second target (if it breaks the resistance zone of 320-350 ) would be 400. Keep stop loss as per your risk capacity or if it goes below 180. [Positional View] Good Luck! 😊