Today let’s do analysis of Reliance Industries Charts and identify the possible moves and opportunities. First we will study the stock’s weekly chart. In weekly chart of the stock we can see the long term support zones and resistance zones. We can see that last time it hit the support zone in the month of March 2023. And the it bounced from there and moved up. After touching 2500 level, it took a pause and now last weekly candle it made is a good bullish candle. By looking at this, it looks like its trying to go up.
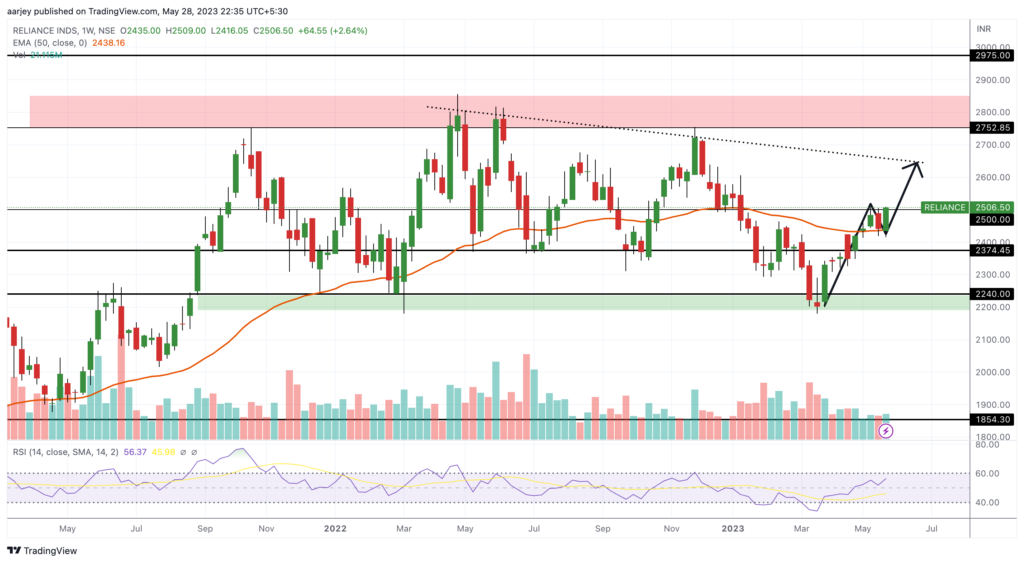
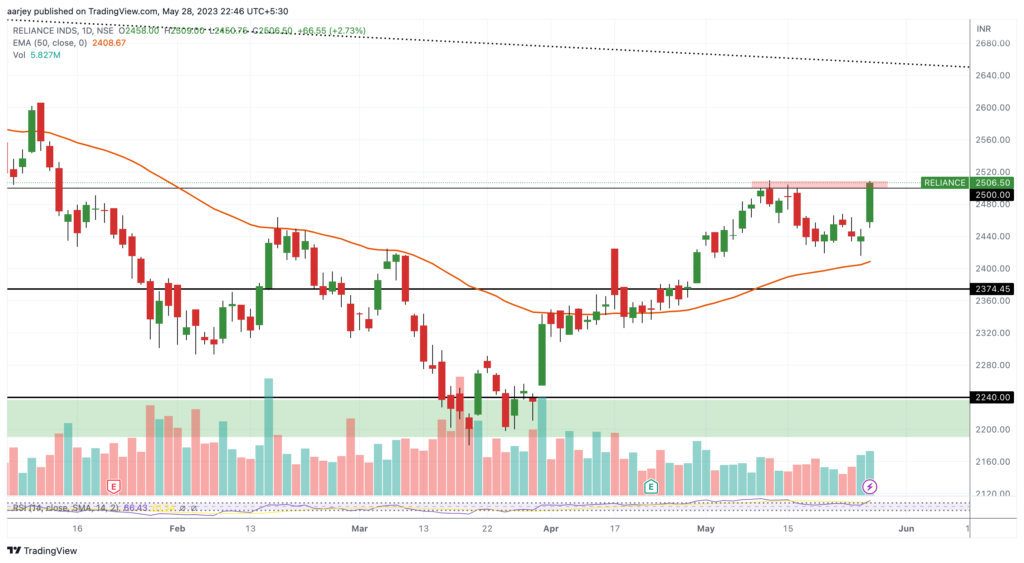
Now looking at the daily chart, we can see that it is trying to give a breakout (above 2500 level). So now can we take the position in this stock? Yes, we can enter in the stock above 2500 level and hold it till its first resistance line (dotted line) near 2640-2650. The next target can be upto its all time resistance zone which is near 2750. Keep an SL below the weekly green candle (below 2415) or as per your risk capacity. This is positional view. Be profitable. Good Luck ✌️

Update on 14th June: Reliance is still looking bullish. After my above post, Reliance was struggling and two weekly candles were not able to give breakout. Now this weeks candle is again looking bullish so far. So if it forms a good green candle this week, the above target details are still valid. Watching and trade accordingly. Good Luck 🤞.
