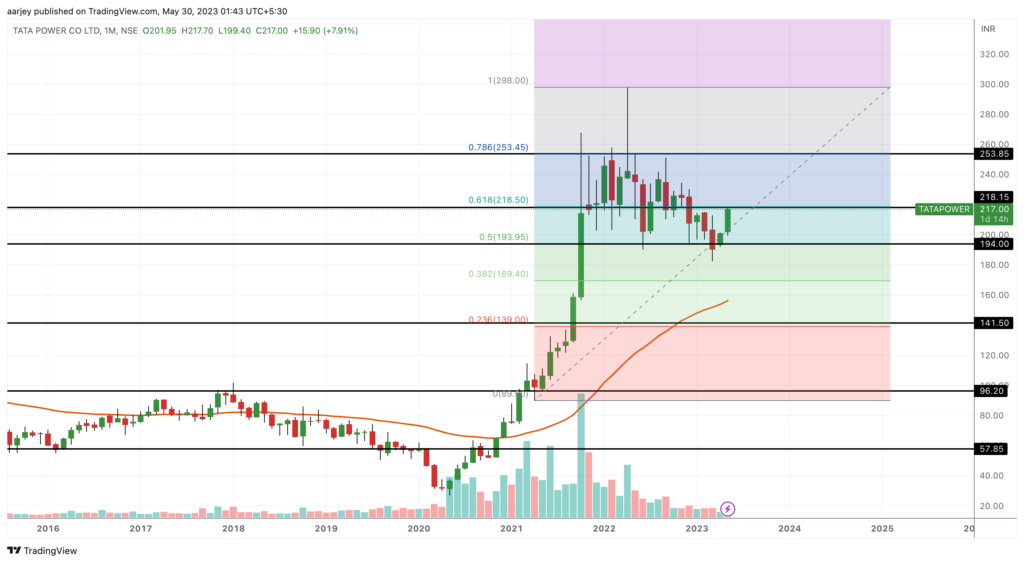
Tata Power is Tata’s power supply and transmission company. Let us see its stock chart today. First we will look its monthly chart. In monthly chart we can see that after giving a breakout near 96, it continuously moved up until it touched 298 (near 300 level). Then it started its retracement. I applied Fib levels to it. And we can see that it retraced till 0.5 fib level (near 194) and took support there. Now two green candle indicating that it started its upward journey again.
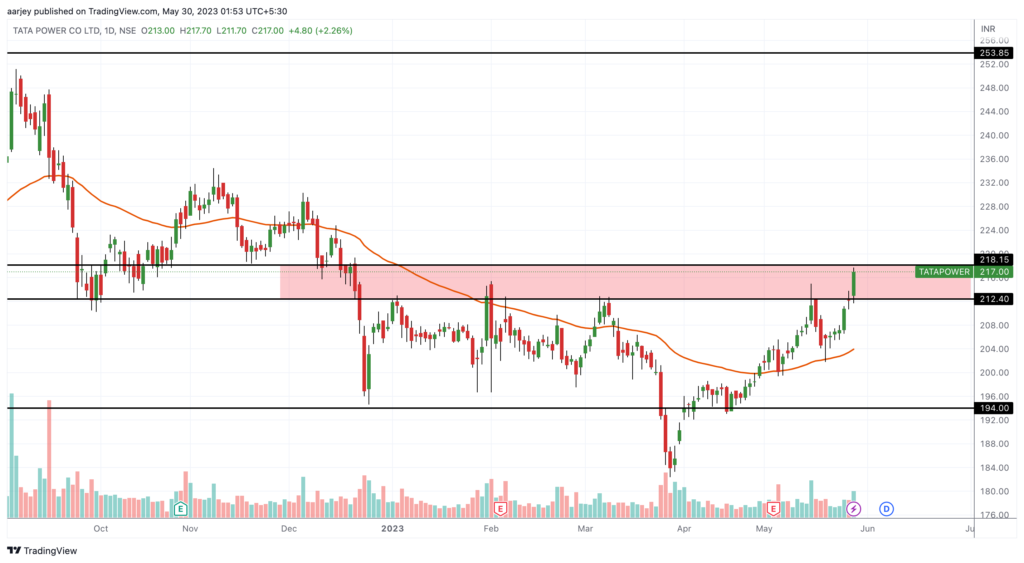
Now let’s come to its daily chart. In daily chart we can see the resistance zone ( 212 – 218 ) and stock it now trying to break this resistance zone. We can take position at current levels ( 212 to 218) and hold to for a target of 250. Keep SL below 200 or as per your risk capacity. This is positional view. Good Luck. ✌️