Today let’s do technical analysis of Tata Steel Stock. Since Aug 2021, this stock is trading in a range which keeps on narrowing and is forming a triangle. In weekly chart, we can see its triangle pattern. Now this triangle is too narrow and stock break-out chances are increasing. Break-out can be on any side.. means it can go up or go down.
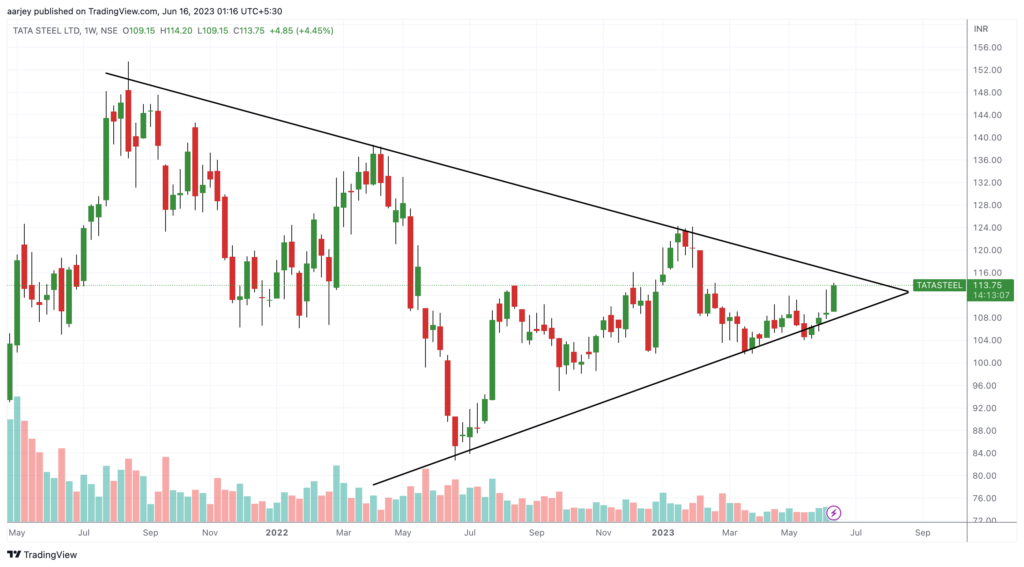
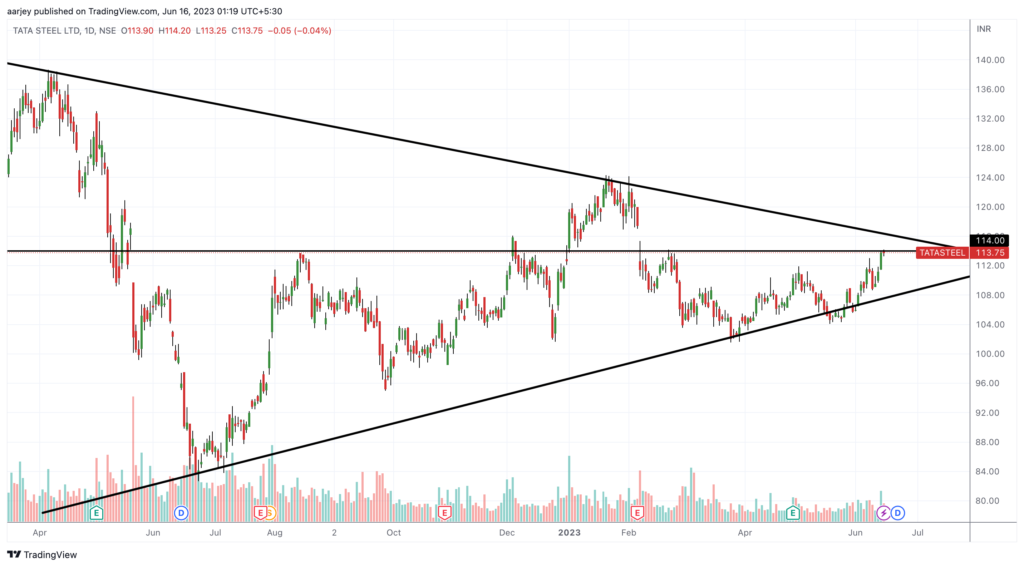
In weekly chart, we can see it formed a good bullish candle this week. So can it gives break-out on upper side? Let’s see its daily chart as well. In daily chart we can see its at small resistance line near 114. If it goes up, and if it gives triangle break-out with good green weekly candle closing outside the triangle, then that would be our entry time. If it takes resistance and fall back inside triangle then we will look for it break-down and short positions. So till it gives break-out, keep watching this stock. Good Luck 👍✌️