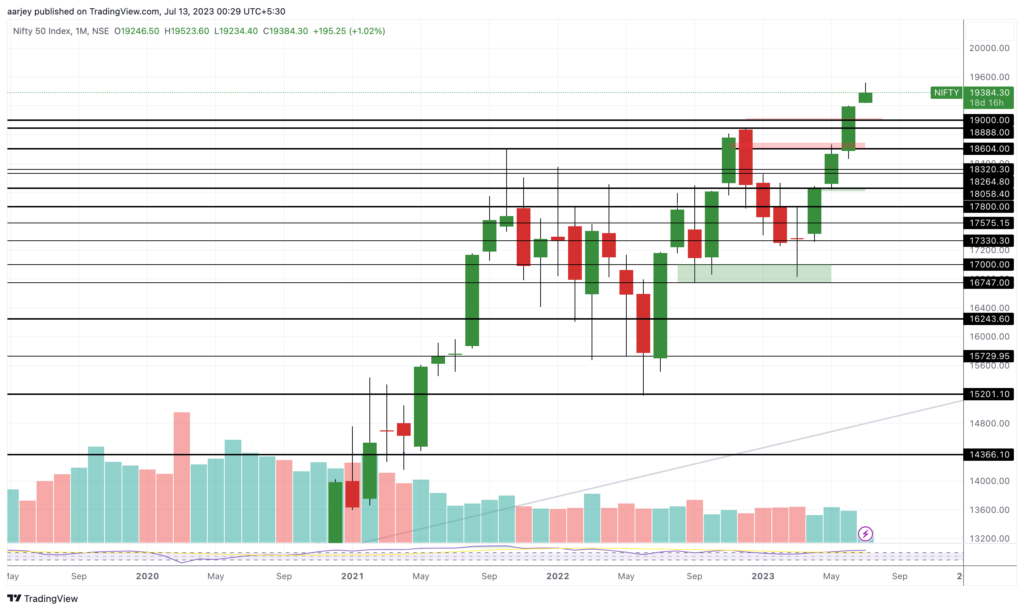
Let’s do analysis of Nifty now. After Nifty’s last correction phase (which started from December 2022 and it went till March 2023 ), it started the bullish move and bulls pushed Nifty to All time high of 19523 in this month (July 2023)
See the monthly chart of Nifty, how it made 3 red candles for the month of Dec ’22, Jan ’23 and Feb ’23. In March, it formed a doji candle which gave a sign of reversal. Also this doji candle was formed on the support zone near 17000. From Apr ’23 to June ’23, Nifty formed solid green monthly candles. Now we are near the mid of July, and now we see that Nifty is facing some resistance near the highs.
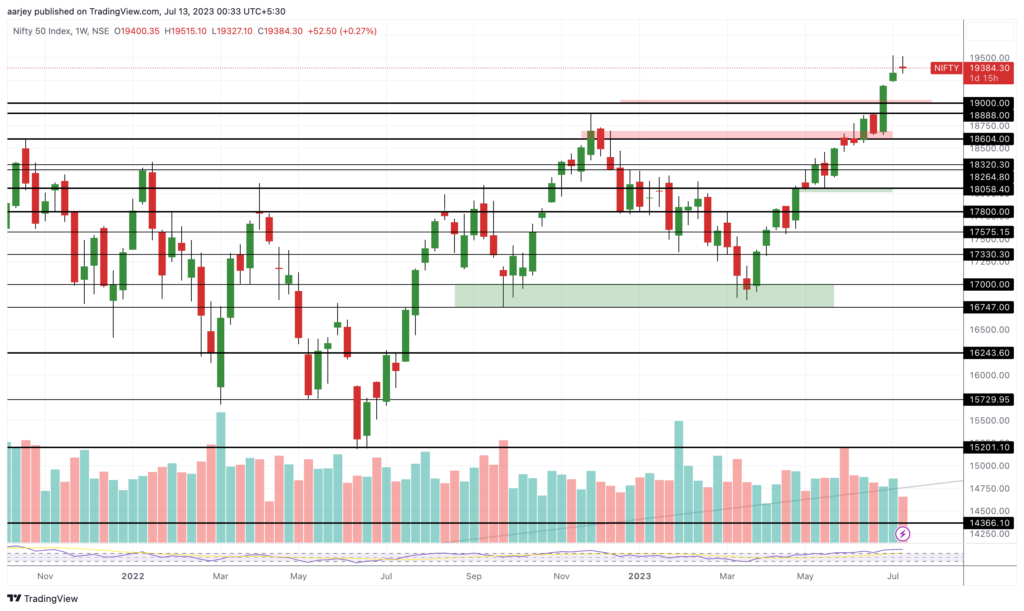
Now let’s look Nifty’s weekly chart. In this chart we can see that, July 1st week’s candle is not looking good as it has a long wick on upper side indicating resistance. This week’s (July 2nd week’s) candle is yet to form. So long term view, we will form later. Let’s move on to daily chart.
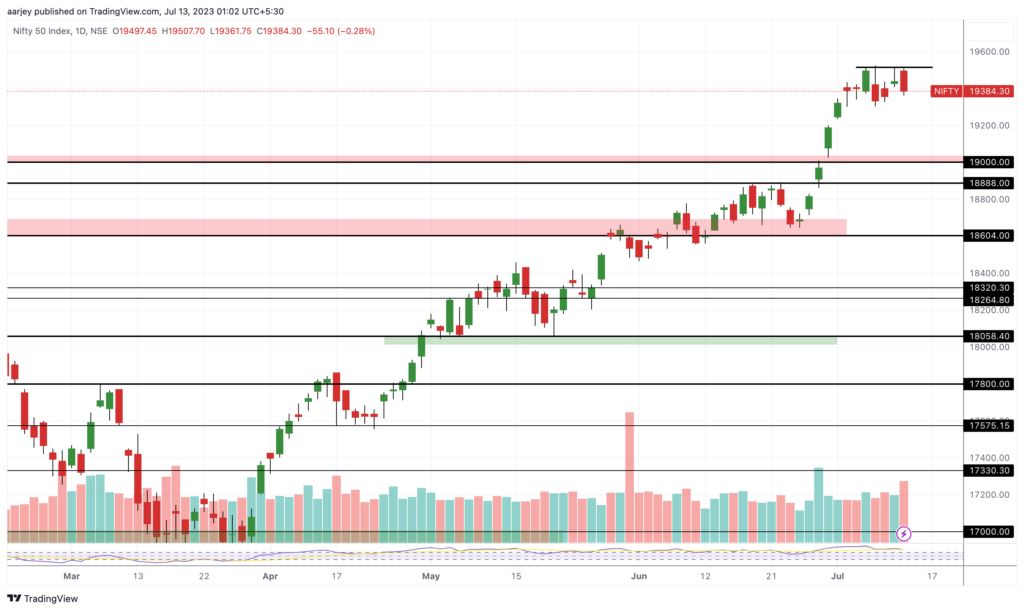
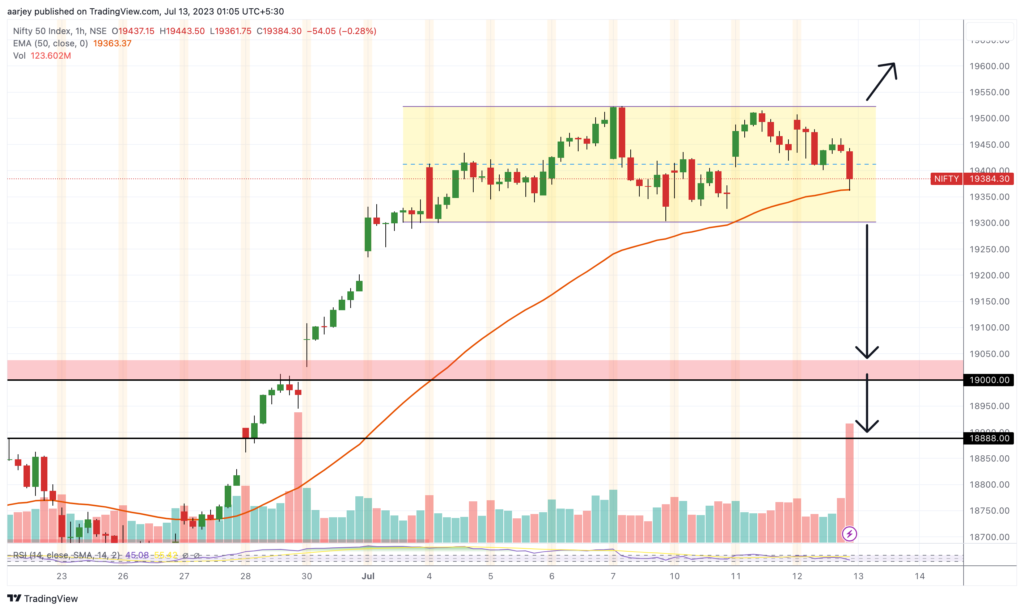
Now, let’s see daily & hourly charts. In daily chart we can see the upper resistance. But the picture becomes more clear in the hourly chart. So let’s discuss about hourly chart. In this chart we can see how Nifty is stuck in this range of around 220 points. Today Nifty took support on 50 EMA but still inside this parallel channel. So what to do now? Just wait and watch. Let Nifty to give a break-out from this channel on any side. If it breaks it on upper side, we will take a buy side entry. If it breaks on the lower side, the it can show correction till levels of 19000 to 18900. So if it breaks on lower side, we will take sell side entry till these levels. Further strategy we will decide later once Nifty shows the move.
Till then happy trading ✌️

UPDATE: Nifty gave a breakout 👍 and we got the buy entry. We are in profit now. Read my next post on Nifty for further analysis. Thank you