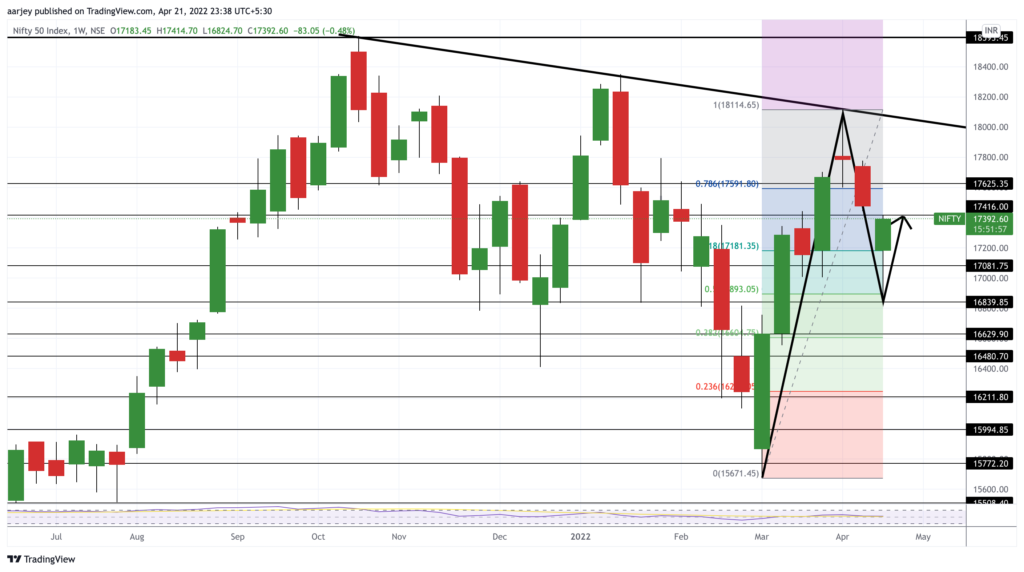
In Nifty’s weekly chart, we can see how Nifty hit the upper resistance line 3 times and came down. Now if we see candles of March and April, Nifty took a dip of 15671.45 and then again hit that resistance at 18114.65. Then again it came down. If we consider this last downside as a retracement of the March upmove, and if we plot a Fib Retracement, we can see that Nifty clearly bounced from near 0.5 Fib level (16893). This is some indication of bullishness and upmove. So will Nifty go up?? Lets analyse further…
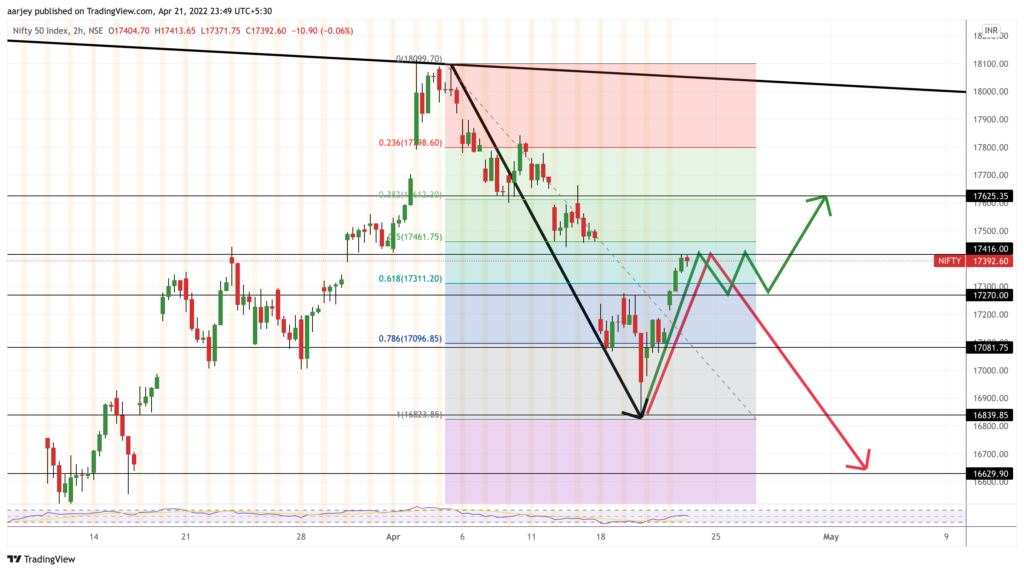
Now let’s see Nifty’s 2hrly (or daily/hrly) chart. Here if consider Nifty’s bounce from 16839 support as a retracement of the previous down move, then we can see it reached very close to 0.5 Fib level.
Now if Nifty has to go upside, I would expect Nifty to halt and spend some time near this zone ( 17461 – 17311 ). If keep holding the price in this zone for some time it will try to go up and then we can see next levels like 17625, 17800 and till the resistance line at top. But if Nifty starts falling after taking resistance near 17461 – 17416, then it will follow the fib and continue its downside journey after this retracement.
The view is for coming weeks/month/s. Do analyse yourself also. Have a profitable trading. 👍✌️
