Let’s analyse Reliance Industries weekly chart. We can clearly see that Reliance is in uptrend but movement is in a parallel channel since July 2020. Now it is hitting the upper resistance of that channel 3rd time. So is it going to give a break-out for another rally? Or is it going to fallback in the channel? Let’s analyse further.
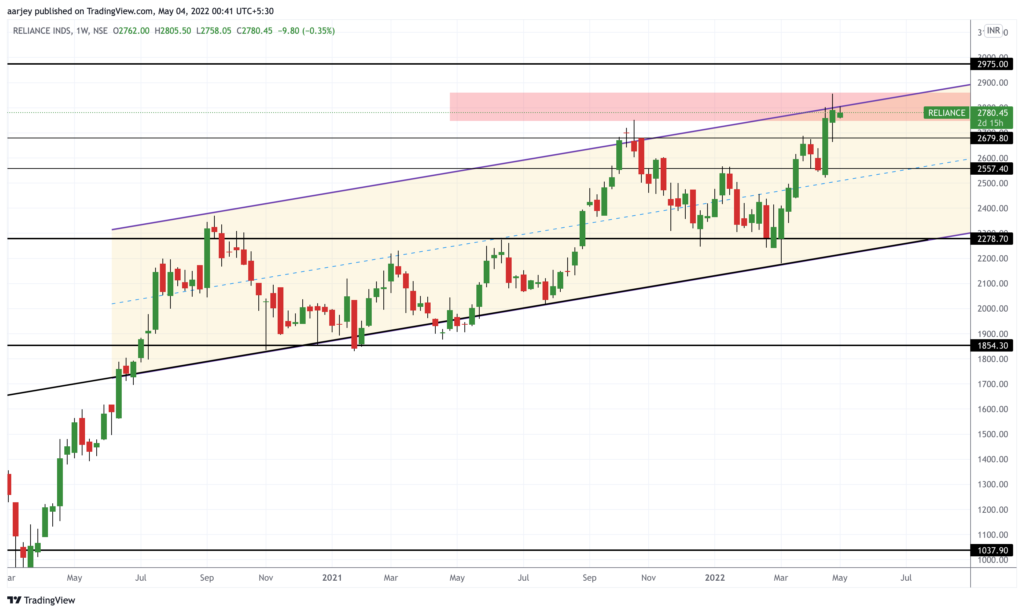
Right-now Reliance is in resistance zone which is 2750-2850. If it is able to break this resistance then only it can go up and targets can be between 2975-3000. If it looks weak and unable to break the resistance, it can come down to a levels of 2680 and 2560. Chance a looking more towards down side move.
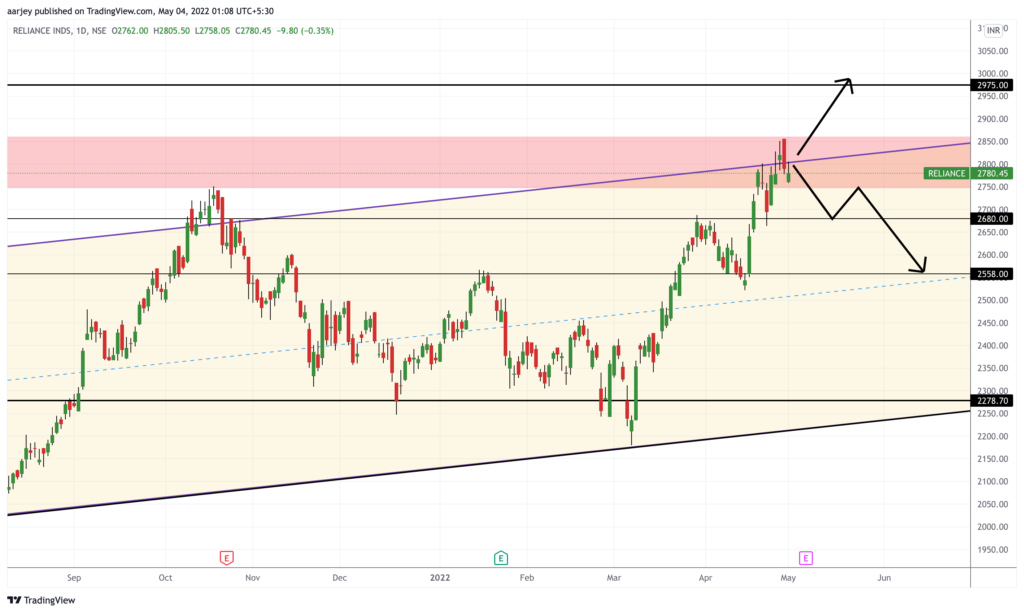
If it remains near the same level for longer period then chances of going up will increase. Do analyse yourself too.
Have a profitable trading ✌️
