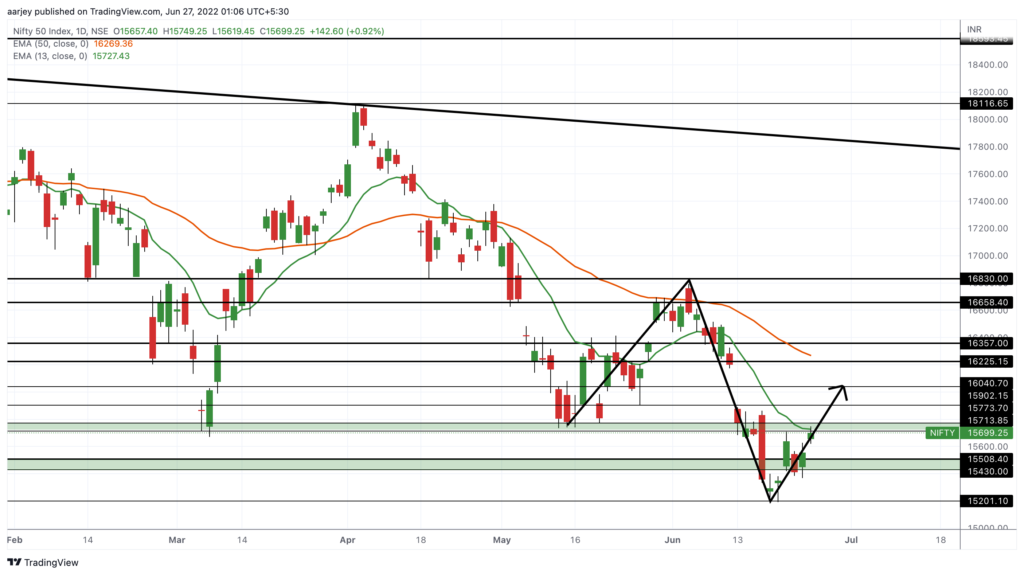
Let’s analyse Nifty. If we see Nifty’s daily chart, as per the price action, and as it took support of 15430 – 15508 support zone in monthly candle, it indicates retracement. But how much. So If we see in daily chart, Nifty retracement can be somewhere upto 16000 – 16225 levels. 16000 is a psychological level so it will work as resistance and above it 16200 – 16225 will work as resistance. Also there will be 50 EMA touching the Nifty near this level. So it should react at this level for some time. We will further analyse after looking what Nifty is doing at this level. If it takes pressure, it may start falling again. If it sustains, then we will have to analyse how for it can go. Till then, have a profitable trading. 👍✌️