Let’s look at the Adnai Ent. chart. For this stock, it looks like 4000 to 4200 is a strong resistance zone. It started falling from that zone from 21st of Dec 2022. After taking some minor support near 3625 it tried to goo up but its falling again. As soon as it breaks this support, it will fall to touch 3416 and can go upto its final support which is 3200. One can initiate short trades as it gives a closing below 3600. positional view (for 1-2 weeks upto a month). Adani Ent’s daily chart is here. Check it out. Happy Trading 😊😊😊
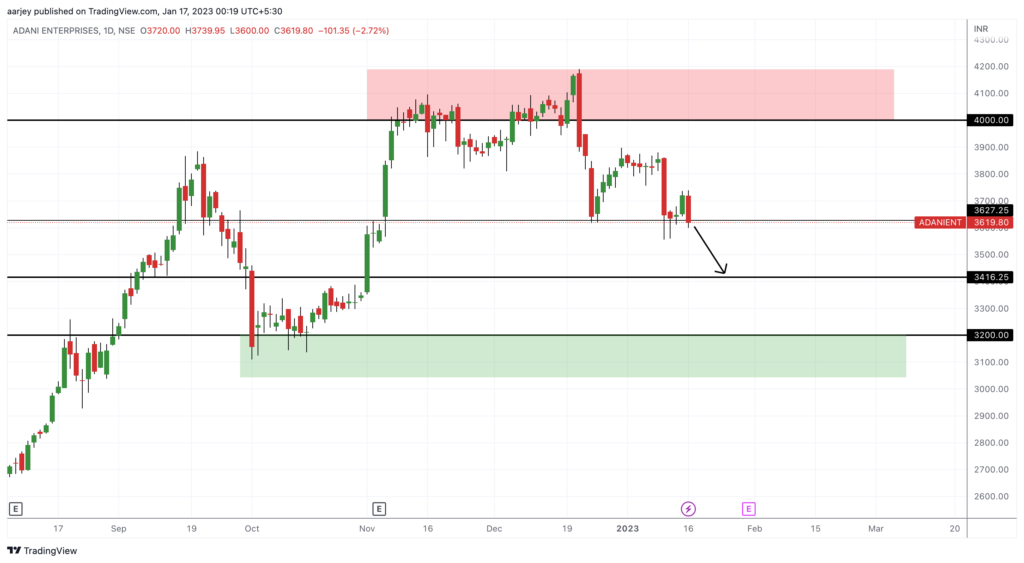

Just after 5 trading sessions, Adani Ent. hit its first target and made a low of 3412 today i.e. 23rd Jan. This analysis I posted on 16th January and as per that analysis we hit the first target. You may book half of the quantity and hold the rest for second target. Keep SL at cost to cost now. Enjoy your profit and happy trading. 😊😊
