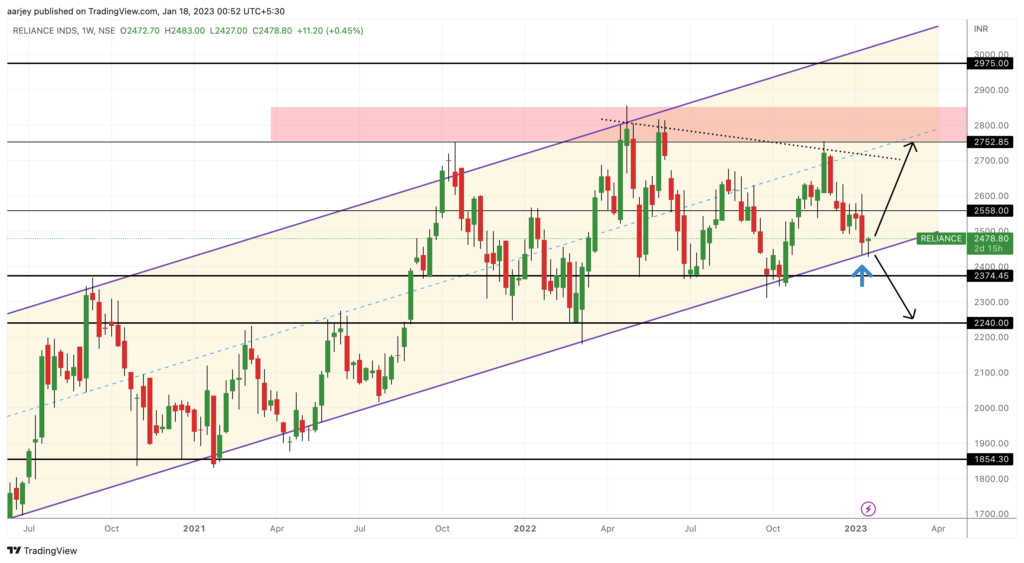
Time to analyse Reliance Industries. First let’s look the weekly chart. As we can see in weekly chart, its moving in a parallel channel from long time. Also we can see that it has a resistance zone above 2752. Right now its taking support at the lower line of channel. If support works, it will show some upside.
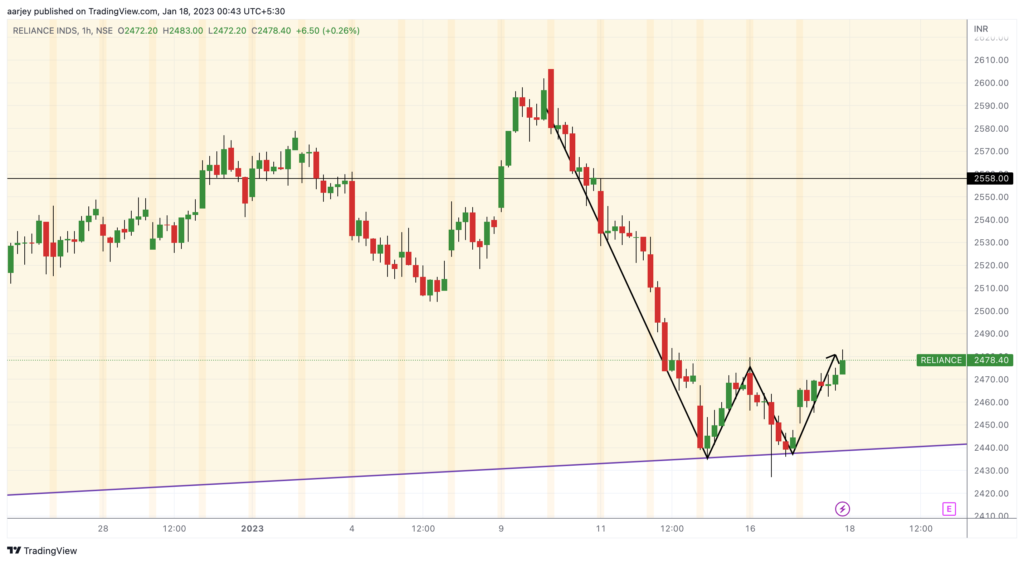
In daily chart, we can clearly see W pattern. If this pattern triggers, we will surely see upmove. So what should be our plan of action? We can take long position with only 50% quantity right now. If it goes up and when it comes again near 2480 to retest, rest 50% can also be used. Our long side targets should be 2700, 2800. Now what if it breaks the support and falls? Then we can average it near 2440 – 2480. If it breaks the bottom of W, then our sell side targets would be 2374, 2240. Play accordingly for the right move. Happy Trading.