IDFC FIRST Bank is a private sector bank in India and growing rapidly. Let’s do technical analysis of this stock.
First, let’s look its monthly chart. If we look its move from June 2022, we see that after falling till 29, it took support zone and started moving up month on month. Till Nov – Dec 2022, it went considerably up and then it took much required retracement but keep holding the support zone between 53 and 55. Now last month’s candle (Apr 2023) is a good bullish candle indicating that now its ready for further upside
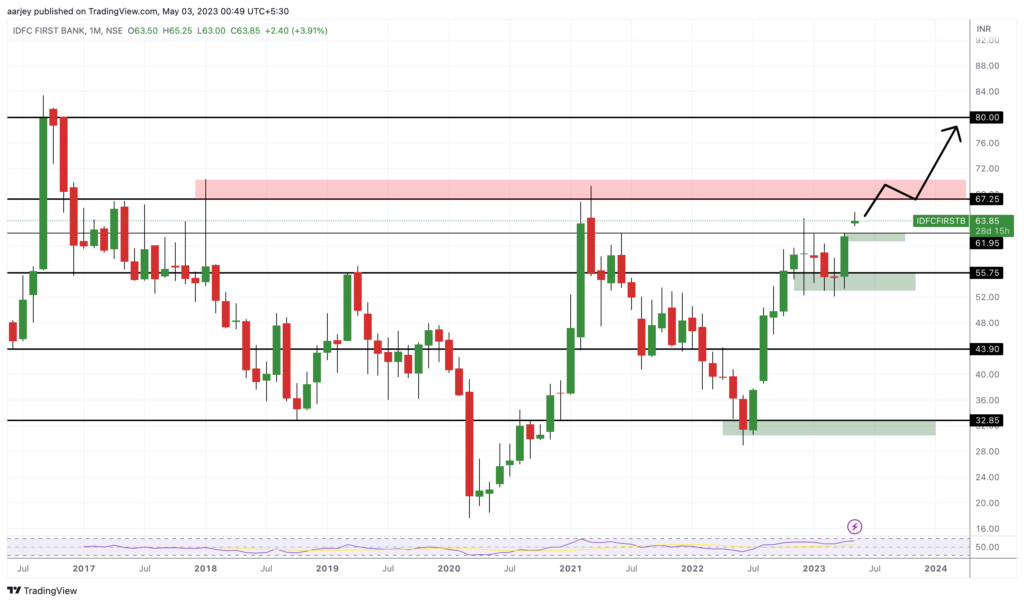
Now how we can make entry? Currently its trading near 63.85. One can take entry if it falls to its support between 60 and 61. At first, it can reach to level of 67 to 70 and this is its resistance zone. Once it gives a breakout out of this zone, fresh position can be taken for a target of 80 to 85. Keep your stop loss just below 52 and if goes below it, close your position. This is positional view. Happy Trading 😊
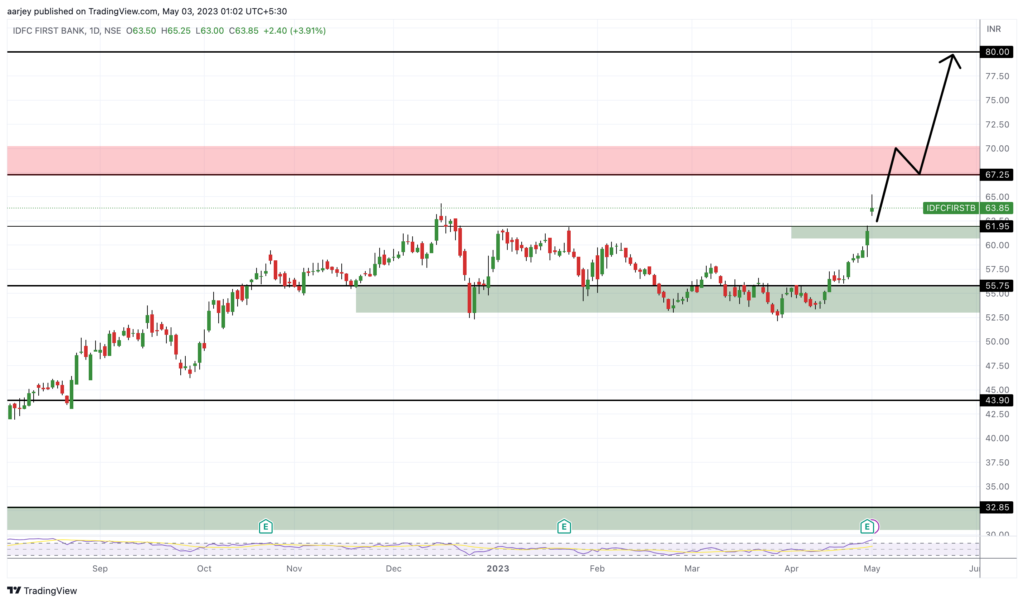

Wowsome !!! Full profit in just 1.5 months.