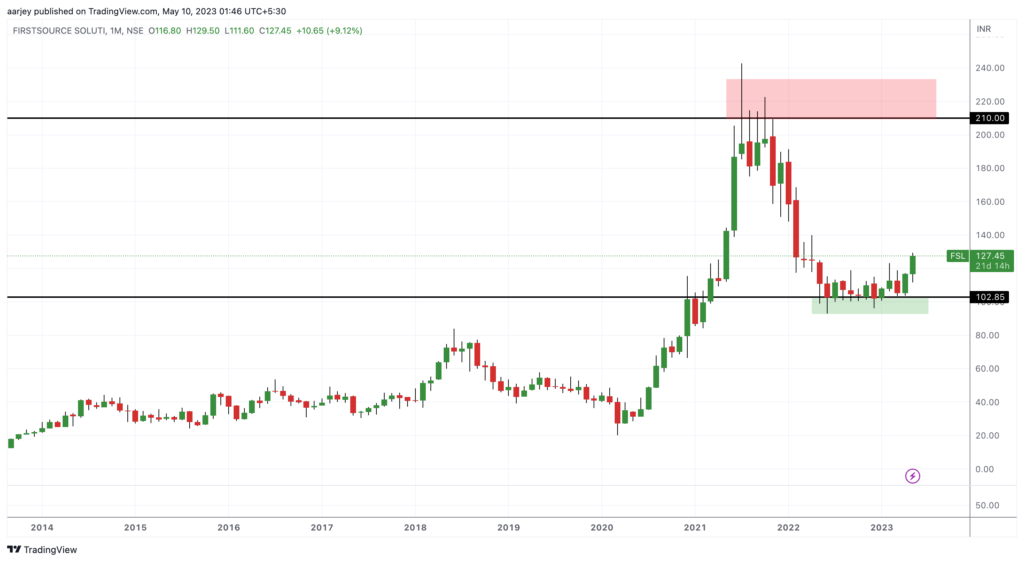
Today let’s do analysis of FSL i.e. Firstsource Solutions Ltd. Looking at the monthly chart we can easily identify its support zone which worked well since June 2022 and almost a year its just keep on trading on this support zone. Now this month candle so far is looking bullish.
Now lets have a close look at daily chart. In daily chart, it looks like it has given a breakout already. We can also see huge volume in the breakout candle. So looks like chances of sustaining this breakout is high.
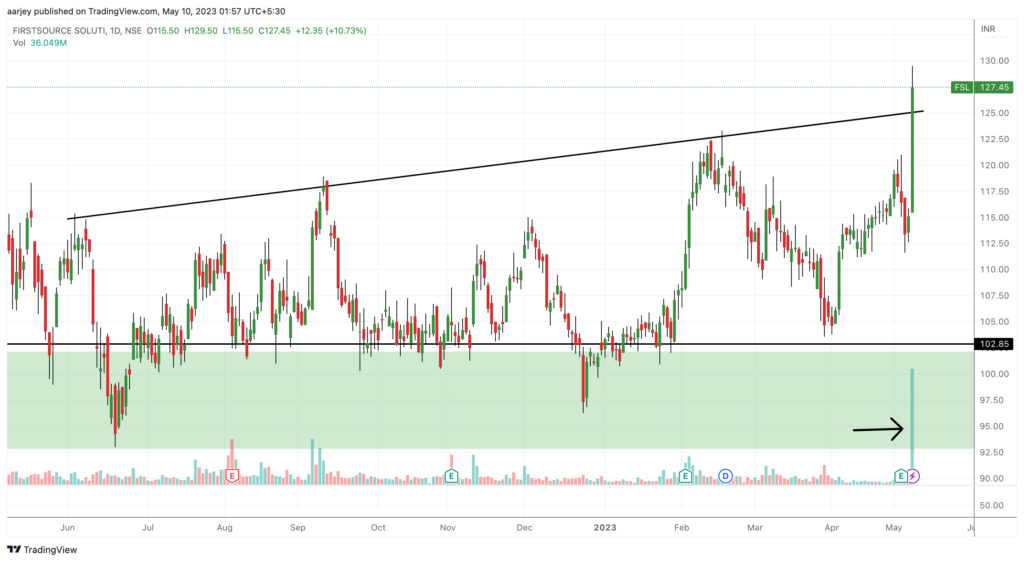
So now where can we enter. So our entry is anywhere between 120 to 130. Keeping a stop loss below 100, we can look for targets of 200 – 210. This is positional view. Happy trading. 😊
