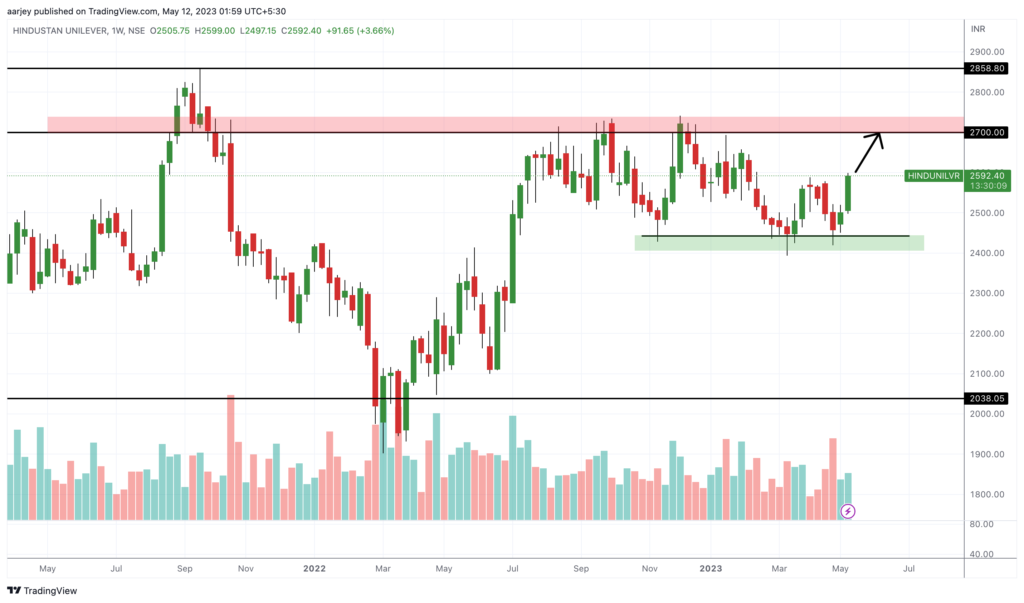
Hindustan Unilever Ltd. HUL is a heavy weight stock and today let us do analysis of this stock. First let us see its weekly chart. In this chart we can see that it is taking support in the zone of 2400 – 2440 from past 6 months. Now it is trying to give breakout. Also we can see that its resistance zone is somewhere between 2700 -2740.
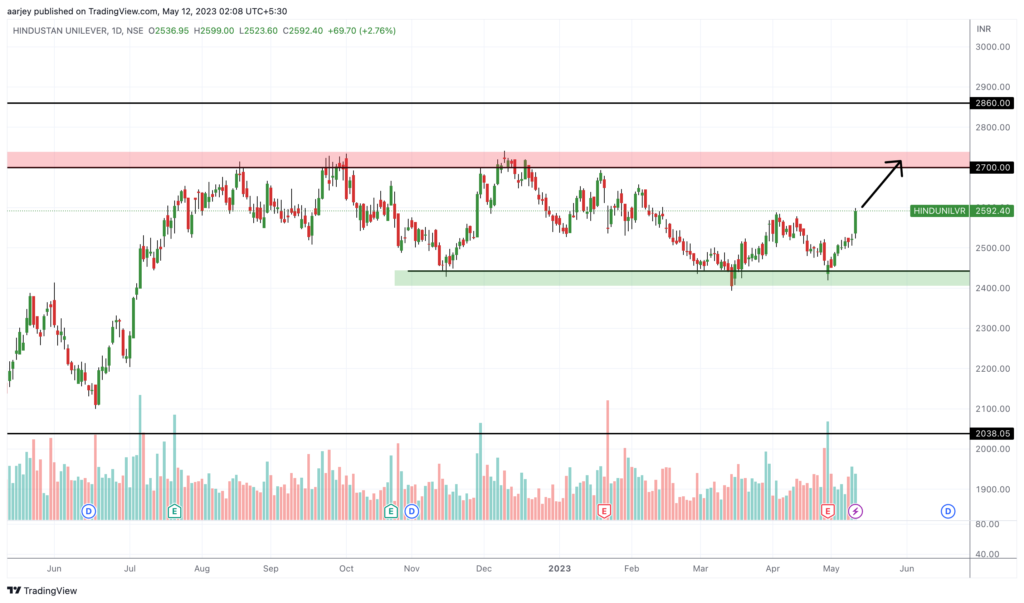
Now let’s have closer look of stock in daily chart. What we can do? We can take position if it starts going above 2600 for a target of 2700. As we can see, the stock hit this resistance several times in the past. So now the resistance is getting weaker. So if it starts trading above 2700 for some time, the its can touch 2860 and even 3000. Keep an SL as per your risk capacity. This view is positional.