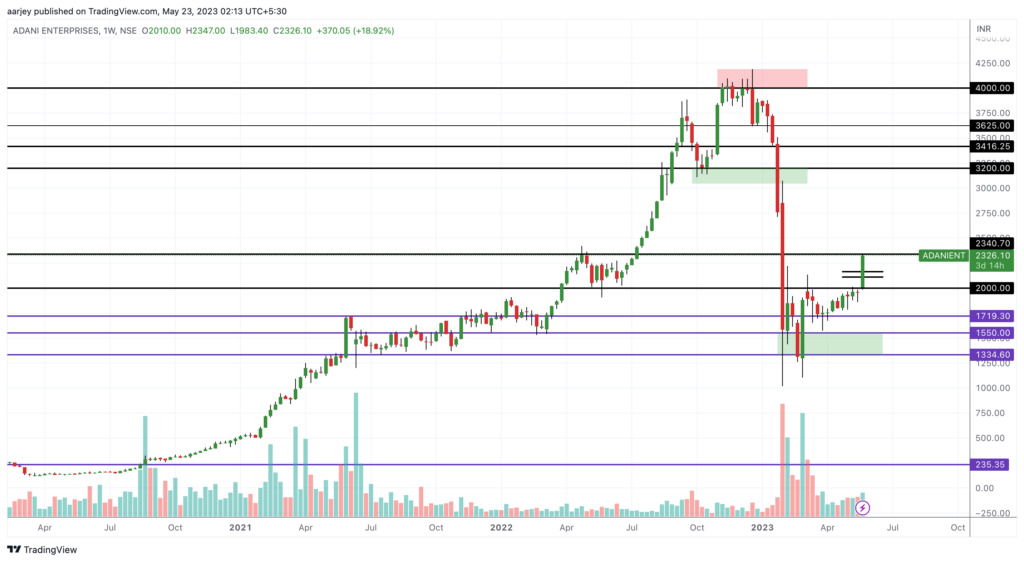
Today on 22nd May, after long time Adani blasted and gave super bullish move with 18.92% up in a day. As per data, the total quantities bought is 26,311,368 and as we know open price was 2010 and closing price is 2326. This is a huge volume, and it looks like 2000 level should work as a strong support in future.
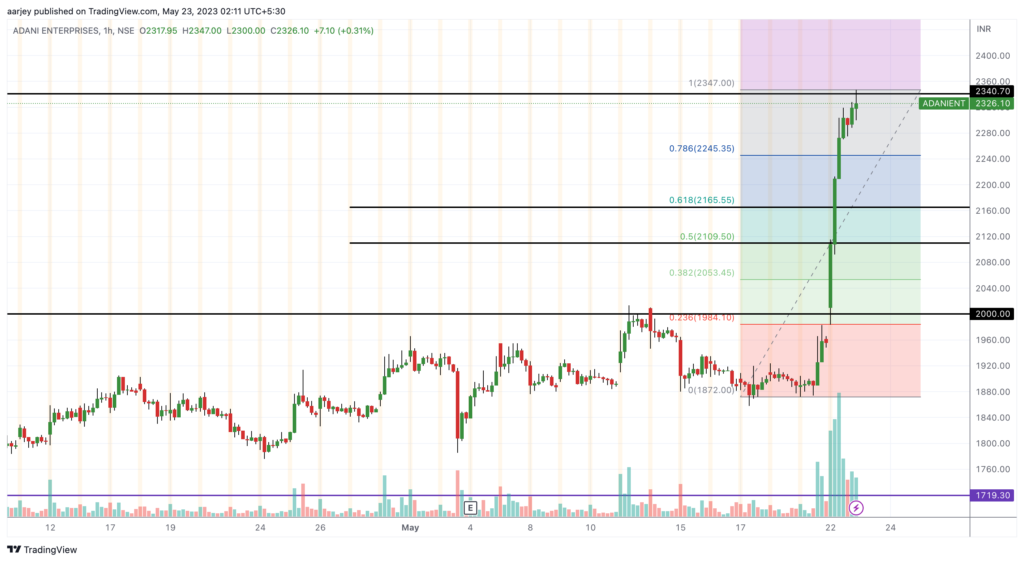
Now lets talk about if we have any opportunity in it. If we see its charts, we can see that it just hit its resistance line (2340). Now lets apply Fib levels and we can see that the good entry levels will be between 0.5 and 0.618 levels. So if the stock comes near these levels (between 2110 and 2165) take entry with half quantity. It should take a bounce from these levels and should move up. If in case it comes further down then average with remaining half quantity near 2000.
If in case, stock doesn’t come down upto 0.5 or 0.618 levels and it takes support from 0.786 level, then enter full at the breakout ..meaning as it goes above 2340. Targets can be 3000 – 3200. This is positional to long term view. Happy Trading 😊