Today we are doing analysis of stock Balkrishna Industries. Let us first see its monthly chart. In monthly chart we can clearly see that this stock is trading inside a triangle pattern from a long time (around 2 years approx). Now this month (May 2023) its trying to form a break-out candle.
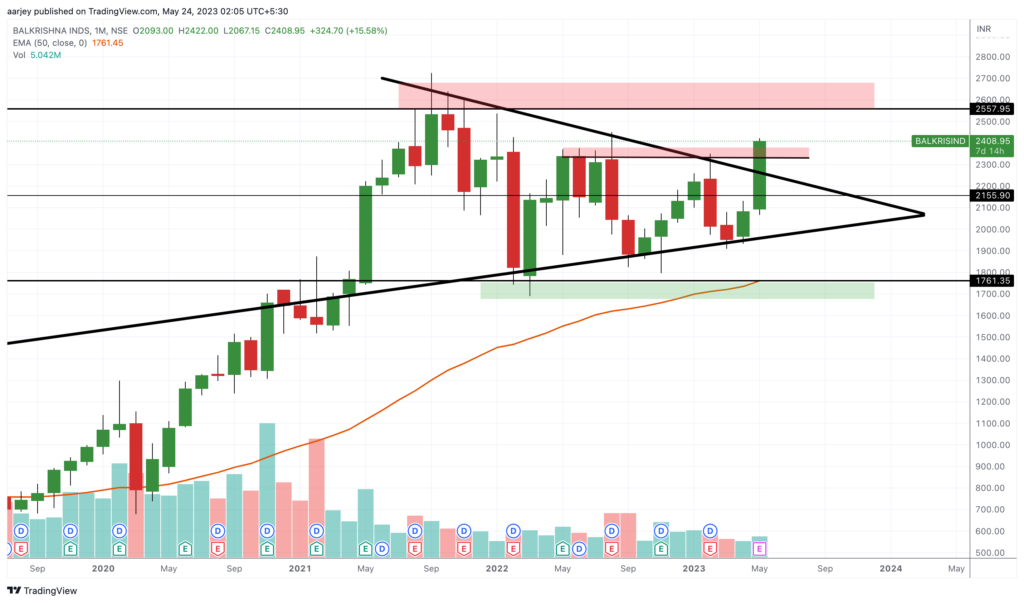
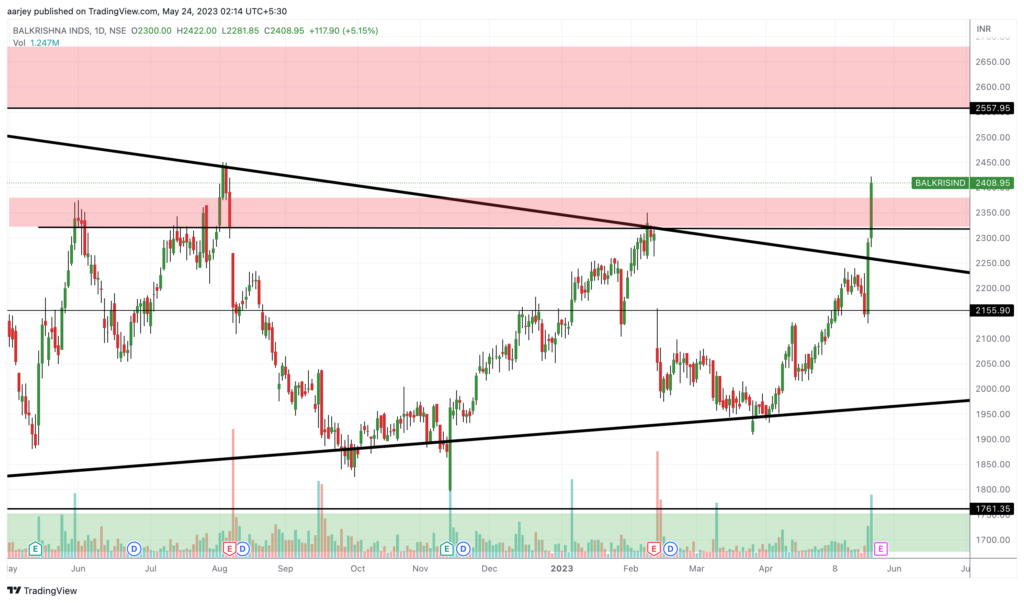
So for now, its looking quite bullish and we can keep an eye for the opportunity to enter in the trade. Currently it closed at 2408. So if it comes down to retest, we can enter near zone of 2310 – 2340. And its target is not that far. It is 2600. Keep an SL as per your risk appetite. Happy Trading.