HDFC AMC which is HDFC Asset Management Company, its stock chart is looking interesting. So lets do analysis of this stock. Lets look at the monthly chart. In monthly chart we can see that its all time support zone is near 1700. If we take a look on last few months candles, the stock price hit the support level and started reversal signs from March 2023, and in April 2023, it formed a small green candle. In May, it formed a good bullish candle indicating that yes, its ready to go up now.
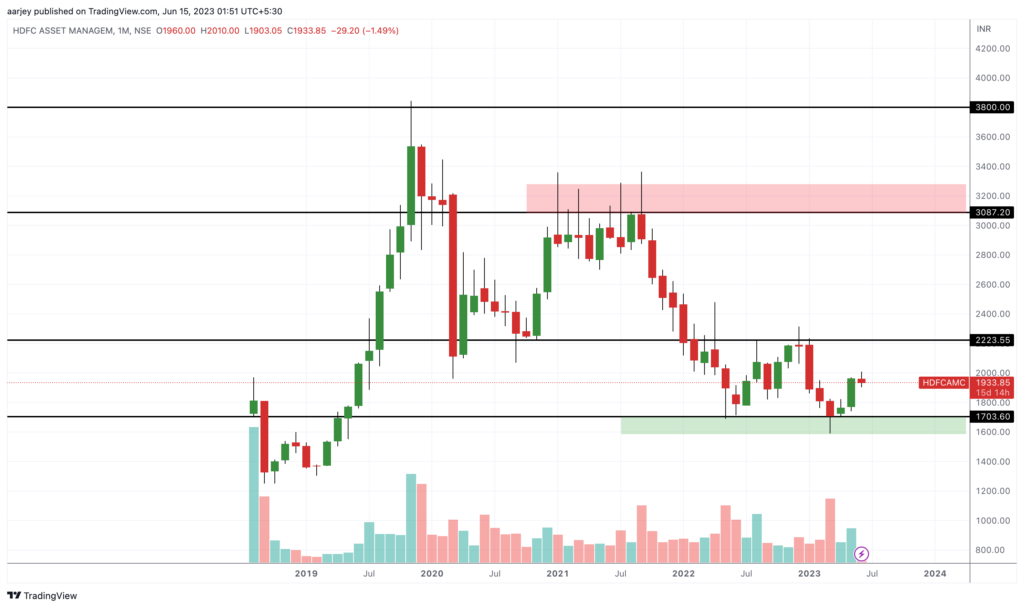
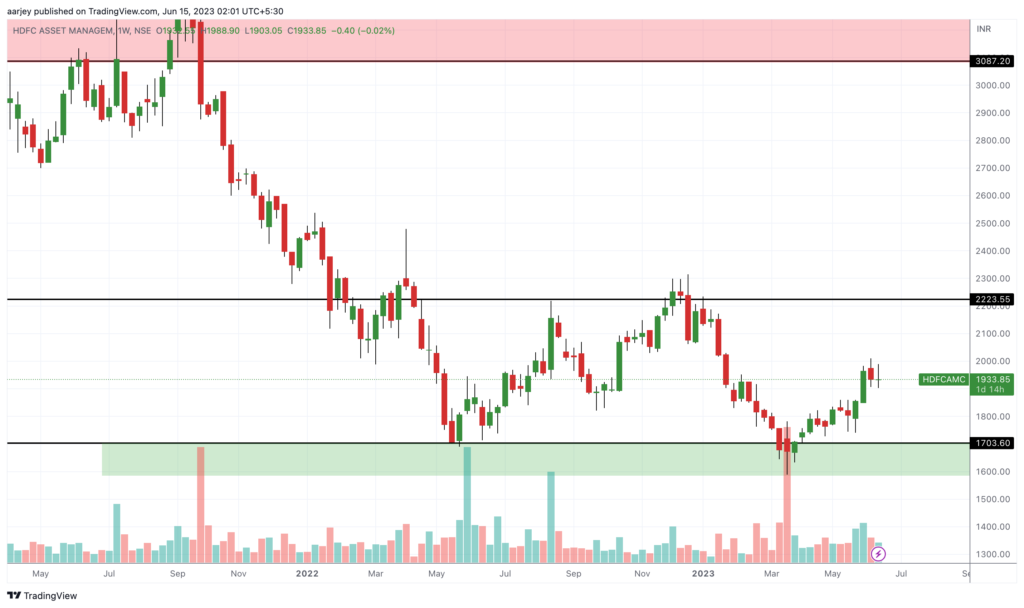
So when can we enter? In daily chart we can see that it can correct little bit. So we can enter near 1850 – 1900. And our first target would be near 2220. You can take entry with half quantity and if it come down near 1700, or if goes above 2000, you can enter rest of the quantity. If it moves above 2220 in monthly candle, it can go upto it main resistance zone near 3080. Keep an SL below 1600 or as per your risk capacity. Good Luck 👍 and happy trading.

Wowsome!!! HDFC AMC achieved our first target within 15 days of the post.
Entry given was 1850 – 1900
Target was 2220.
Target achieved on 30 June.
Currently trading at 2282 on 11 Jul.
Around 17% returns in 15 days. 👍👍👍
With an SL of 2210 we can keep holding it for higher targets as mentioned.
Happy Trading ✌️