Today let us see charts of Gujrat Gas (GUJGASLTD) and let us do the technical analysis of it.
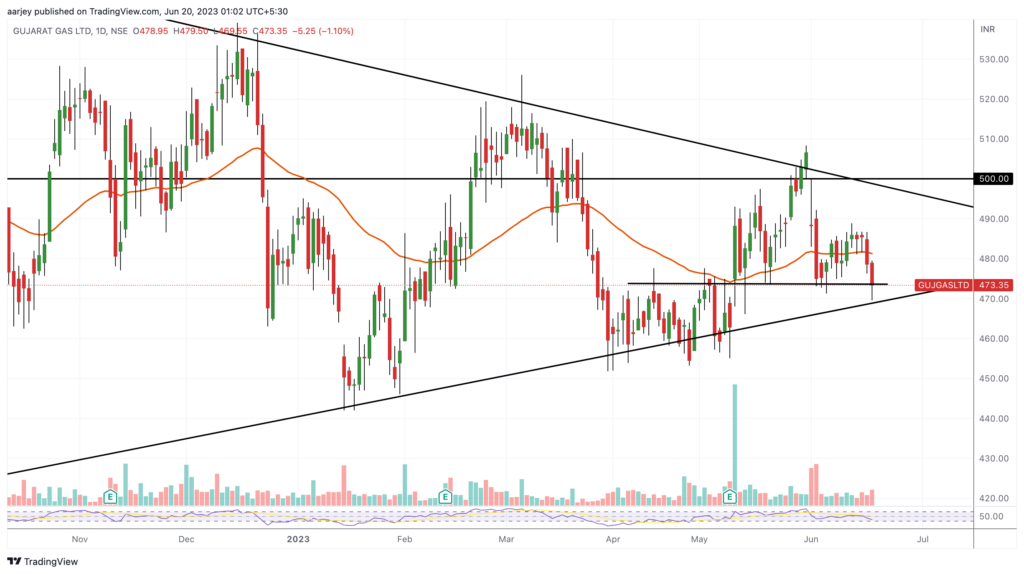
Looking at its weekly chart, we can clearly see that from last 1 year this stock is trading in a range which is continuously decreasing and forming a triangular pattern. Now its very close to give break-out. It can give break-out on any side. Meaning it can become bullish and also it can break down side and become bearish.
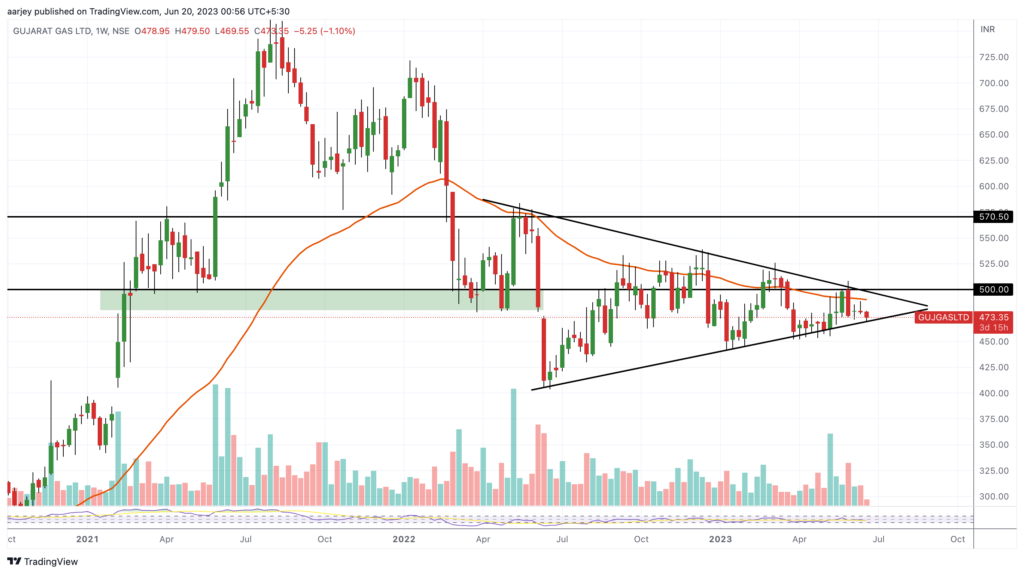
In the weekly chart, we also see that the stock has resistance zones near 500 & 570. So what can we do in it if it gives break-out? If it gives weekly closing above 500, we can taking long (buy side) positions for a target of 570+ with an SL of 30 points max. And if it gives a break down, we can take short size position in the stock below 450 with a target of 400. Early position takers can try below 470 as well for targets of 450 first and then 400. Always keep an SL in place as per your risk capacity. This is positional view. Good Luck! ✌️