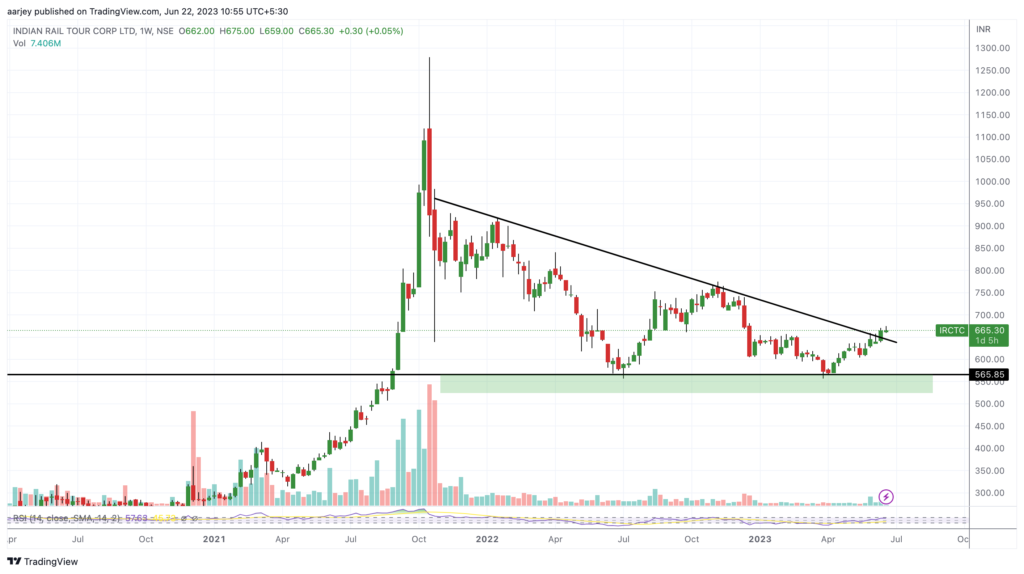
Since October 2021, IRCTC stock started falling after making an all time high of 1279. It was forming a triangle since then taking support on its support zone of 565. Now if we see the stock’s current price action in the weekly chart, it looks like it is trying to give breakout.
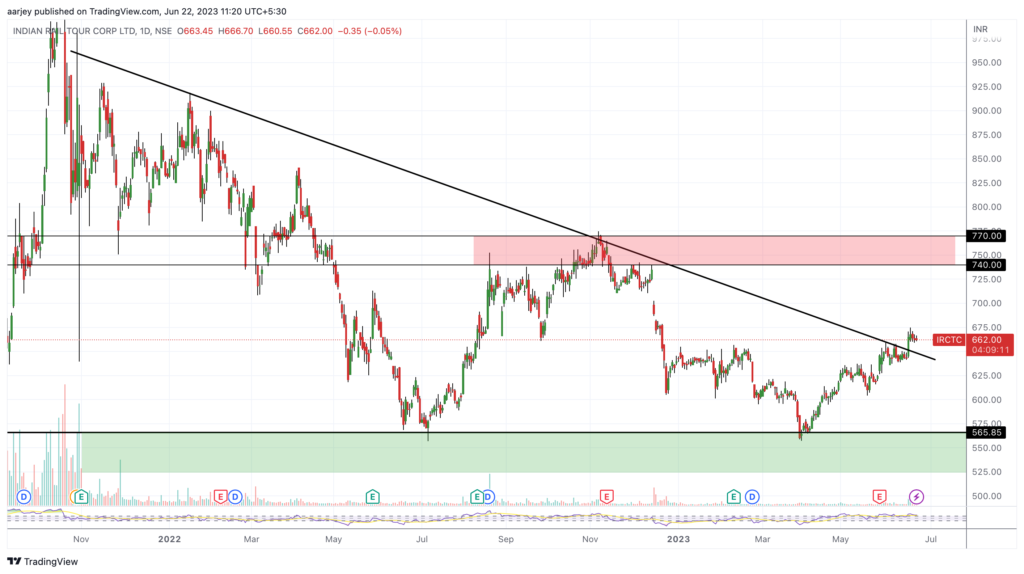
In daily chart we can clearly see its forming a bullish green candle to give breakout. In daily chart we can also see it has a resistance zone near 740-770. Now lets see its 15 min chart also.
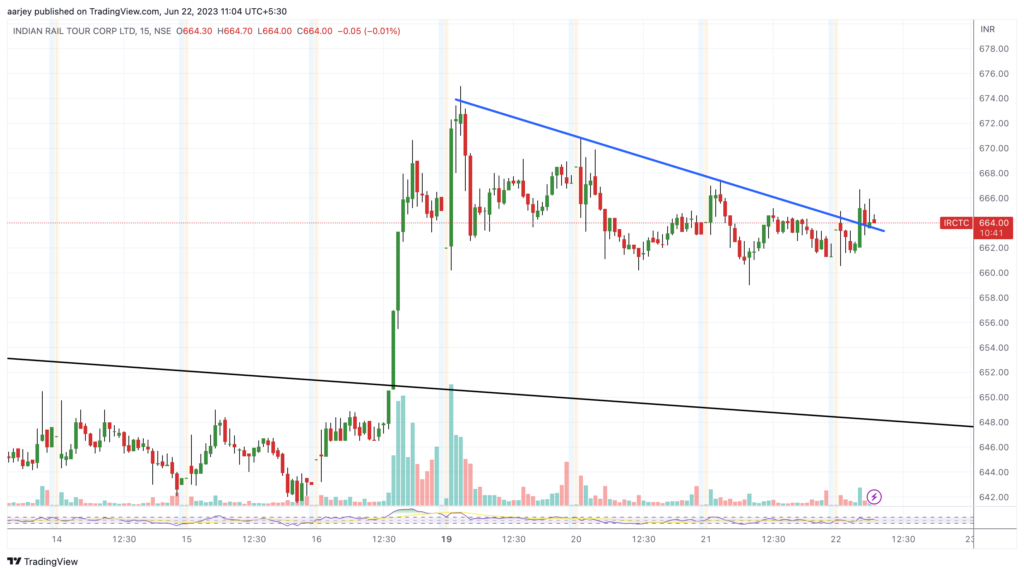
In 15 min chart, we can see the its forming pole and flag pattern which is a bullish pattern. So now how we can take entry? Lets wait for the stock to give breakout. For entry, use half quantity to enter near 668. And remaining half can be used to buy near 675. Keep SL as per your risk capacity or near 640. This is positional view. Happy Trading ✌️

UPDATE: After my above post on 22 June, it never touched our entry levels of 668 & 675. It made a high of 666.7 on 22ns June and then kept falling. So our buy entry never triggered and it took resistance from the triangle and fall again inside. Next buying opportunity will be near its support level. So let it come down near 525 – 565. Or if it again tries to give a break-out from the triangle then we will re-look the entry levels. Just wait and watch. ✌️
